Directivity Analysis of the October 30,
2007 Mw5.4
On October 30, 2007 at 8:04
pm PDT a strong earthquake shook the greater
Figure 1.
CISN Recent Earthquakes Map two days following the October 30, 2007 mainshock. The large yellow square shows the mainshock epicenter, and the smaller squares extending to
the southeast are aftershocks.
The “Did you feel it?” map,
which is a compilation of felt reports shows a maximum
intensity of VI (Figure 2). Remarkably over 64,000 respondents contributed to
the map. Zip code regions east-southeast of the epicenter have higher intensity
values than at comparable distances to the northwest, which is suggestive of a
southward directivity or focusing of seismic wave energy. Although widely felt
through out the bay area, most areas reported intensity level IV.
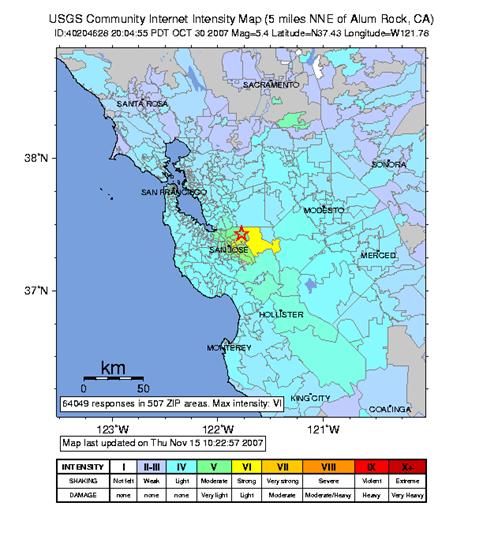
Figure 2.
USGS Community Internet Intensity Map (“Did you feel it? Map).
There are 64,049 respondents contributing to this map in 507 zip code area with
a maximum intensity of VI.
The event was well recorded
by the Berkeley Digital Seismic Network (BDSN). The broadband waveform data
from stations of the BDSN show characteristics, which are consistent with a
southeastward directivity. As Figure 3 shows the BDSN stations BKS, CMB and PKD
have a unique geometry in which BKS and PKD are in strike, and CMB is at the
same azimuth as the conjugate fault plane, or in other words perpendicular to
the rupture fault. While BKS is 64 km to the northwest, PKD at 200 km to the
southeast has the same amplitude. Far field body waves, which carry the peak
amplitude on the displacement records, decay at 1/distance, and therefore PKD should
be less than 1/3 the amplitude of BKS. The lack of amplitude decay at along the
path to PKD is suggestive that the earthquake ruptured toward PKD and away from
BKS. In contrast CMB, which is perpendicular to the rupture fault and a little
more than twice the distance has ½ the amplitude as BKS as expected.
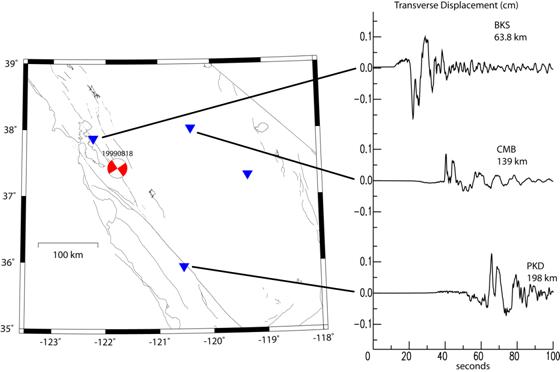
Figure 3.
Broadband displacement waveforms at BDSN stations BKS, CMB and PKD are
compared. The three transverse-component records are plotted with the same
amplitude scale clearly shown that while PKD is more than 3 times the distance
from the source the amplitude of the waves is the same as observed at BKS.
A perhaps more dramatic example of the southward
directivity is in the comparison of the BKS and PACP records (Figure 4). In
this case BKS and PACP are located the same distance (63.8 and 64.0 km,
respectively) collinear and in strike with the mainshock.
Here the peak displacement amplitude at PACP is six times larger than at BKS,
and enriched in higher frequency motions. Both the higher amplitude and
enriched high frequency content at PACP are consistent with rupture toward PACP
and away from BKS.
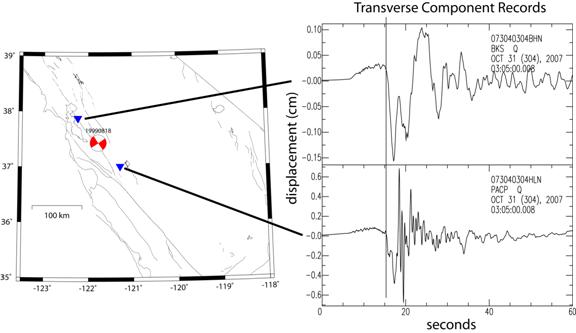
Figure 4.
BKS (top trace) and PACP (bottom trace) are located at the same distance from
the event, are collinear, and are in strike. The marked difference in peak
amplitude and higher frequency content at PACP suggests the earthquake ruptured
toward PACP and away from BKS.
Finally, we have prepared a
preliminary finite-source inversion of the event. We use the method of Dreger
and Kaverina (2000), with a single fault plane, constant rake, rupture velocity and rise time. The data and synthetics were
bandpass filtered between 0.01 and 0.3 Hz. The lowpass filtering was done to deemphasize high frequency
arrivals because of concerns of the adequacy of the velocity model and Green’s
functions. Despite this restrictive filtering the slip model (Figure 5) shows a
dominant component of southeast rupture, with an initial down dip component. In
Figure 6 the fit to the data is shown, and the overall variance reduction was
48%, which is not terribly good. The vertical components are not fit at all,
and given the focal mechanism are theoretically expected to be small. The
observed vertical component records are substantially larger indicating that 3d
scattering is important in this frequency band.
The slip model, and depth of
the slip patch are not very well constrained, but is consistent with the
qualitative analyses presented above arguing for unilateral southeastward
rupture. Future work is needed to more fully document the sensitivity of the
finite-source model parameters.
Also shown in Figure 5 is the
automatic line-source model, which was obtained 9 minutes after the event.
Although for the small Mw5.4 event it was not possible to distinguish between
the two conjugate line-source models, the line-source parallel with the
Calaveras fault shows that most slip is to the southeast consistent with the
refined finite-source inversion result.
It appears that the rupture
extended about 5 km to the southeast of the epicenter, with possibly an initial
down dip component of rupture although this is not well constrained. The peak
slip in this model assuming a rise time 0.3 seconds and rupture velocity of 80%
of the shear wave velocity is 17 cm. An Mw5.4 was obtained from the
finite-source model.
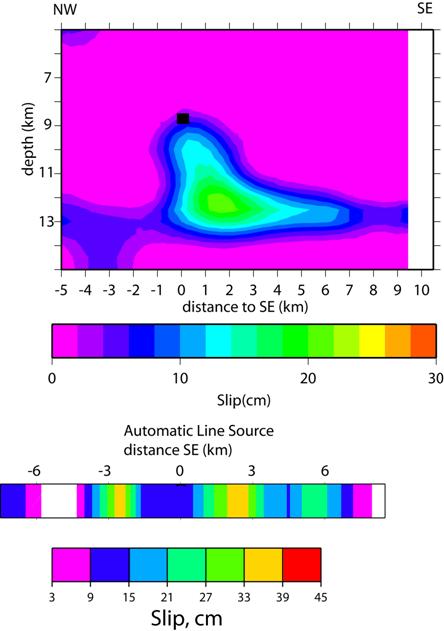
Figure 5 (top) Finite-source model obtained from lowpass filtered (0.3 Hz) displacement records. The
hypocenter is located by the black square. (bottom)
The automatic line-source model (hypocenter located at 0) is compared. The
line-source calculation was completed 9 minutes after the event, and is
consistent with the revised finite-source model.
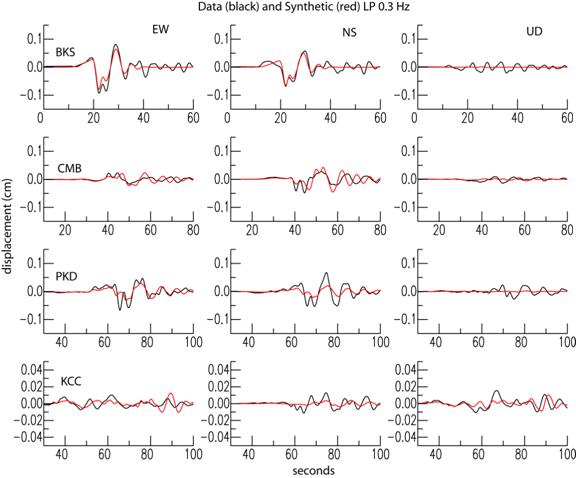
Figure 6.
Three-component displacement data (black) and synthetics are compared. The
synthetics are for the slip model shown in Figure 5. Both the data and
synthetics have been bandpass filtered between 0.01
to 0.3 Hz.