
 Seismic
Moment Tensor Report
Seismic
Moment Tensor Report
for the 06 Aug 2007, M3.9 Seismic event in central
Prepared by: Sean
Ford1,2,
- Summer Intern at the
Last Updated: August 11,
2007
Summary
We
have performed a complete moment tensor analysis (Minson and Dreger, 2007) of
the seismic event, which occurred on
Monday August 6, 2007 at 08:48:40 UTC, 21 km from
Analysis Method
The
broadband stations from the USGS, the

Figure 1. Map with the event location (yellow star) and stations used (triangles). Data from both the red and blue stations were used in Figure 2. The red triangles are the stations closest to the event used for the inversion shown in Figure 3.
For the moment tensor analysis we assumed a source depth of 1 km, consistent with the shallow depth reported for this event. As shown in Figure 2 the results using all 16 stations show a source mechanism with negligible double-couple radiation. It is dominated by CLVD and implosive isotropic elements. In contrast a typical earthquake has a moment tensor solution that is dominated by the double-couple component.
The total scalar seismic moment in this solution is 1.92x10²² dyne-cm, corresponding to a moment magnitude (Mw) of 4.2. The long-period records are very well matched by the model (Figure 2) with an overall variance reduction of 54.1%. The moment tensor solution predicts that the radiation pattern will have dilational (down) first motion in all directions, or in other words a “beachball diagram” that is all white. The nearest stations have better signal to noise levels, and in Figure 3 we show a solution obtained with 6 of the best stations. The two solutions are in agreement, and as the shown the fit to the data is very good quantified by a 74.1% variance reduction.
See http://quake.wr.usgs.gov/recenteqs/beachball.htm for a tutorial on “beachball diagrams” and how they can relate to tectonic earthquakes. See http://seismo.berkeley.edu/~dreger/fmexample.gif for an example of first motions for a tectonic earthquake. Note that neither the preferred full moment tensor solution for the Utah event nor the first motions, as shown below, show the alternating P-wave first motion polarity pattern which is a characteristic of tectonic earthquakes.
See Appendix A below for an example of a moment tensor inversion of a Mw4.4 earthquake that occurred near Alder Montana.

Figure 2. Moment tensor solution using 16 regional stations. The observations are solid lines and the synthetic seismograms are dashed. The P wave radiation pattern, or “beachball diagram” is plotted together with the orientation of the compressive axis. In the moment tensor mechanism, white areas indicate a dilatational, or down P-wave first motion. Since this mechanism is all white, all first arriving P-waves would be expected to be dilatational.

Figure 3. Same as Figure 2 using six nearby stations with excellent signal to noise levels (red stations in Figure 1).
To illustrate why we feel the full moment tensor solution shown in Figures 2 and 3 is correct, we compare a deviatoric moment tensor inversion in Figure 4. A deviatoric inversion does not allow for a volumetric source. The fit to the data is visibly worse. While the transverse component records are fit well in some cases, it is not possible to fit the transverse and radial/vertical components simultaneously. In fact, the variance reduction in this case is significantly worse at only 41.8% more than 30% lower than the preferred solution shown in Figure 3. The P-wave first motion radiation pattern for the deviatoric solution, its “beachball diagram”, is substantially different than that in Figures 2 and 3, having a dominant double-couple component that shows steep dip-slip faulting. This radiation pattern is not consistent with the observed first motions.

Figure 4. Deviatoric moment tensor solution using the same stations in Figure 3. Note that the fit of the data is significantly worse than in Figure 3
P-wave
first motion polarities provide further confirmation of the preferred
mechanism. The P-wave polarities are all down indicating dilational
initial motions. In Figure 5 first-motions picked by Professor Pechmann of the
The conclusion drawn from this analysis is that the source mechanism obtained using shallow (1 km Greens functions) and allowing volume to change at the source (Figures 2 and 3) is consistent with the collapse of an underground cavity.
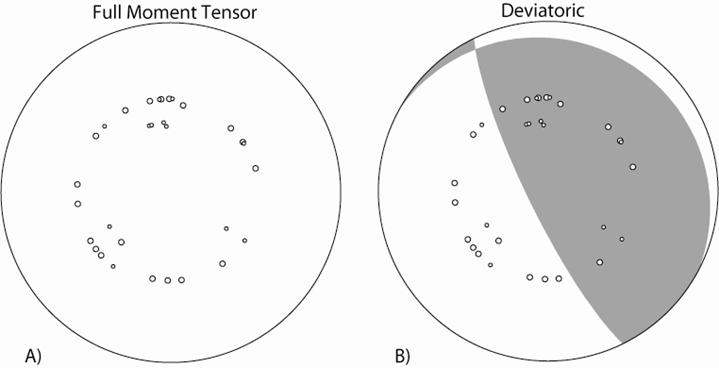
Figure 5.
First-motions picked by Professor Pechmann of the
The
source type plot of Bowers and Hudson (1999) is useful for identifying the
mechanism of the source from a general full moment tensor inversion. In this
type of plot, shown in Figure 6, a measure of the volumetric moment is compared
with the degree of double-couple. Regions of this plot relate to the possible
sources that can be decomposed from a general moment tensor such as a
double-coupled (DC, typical tectonic earthquake), a compensated linear-vector
dipoles (CLVD), dipoles, explosions or implosions, and cracks. The sign on the
x-axis, which passes through the origin, which is a DC defines whether the
major vector dipole of the solution points outward (positive) indicating opening
or inward (negative) indicating closing. Tectonic earthquakes appear close to the
origin in such plots. The solution that we obtained for the

Figure 6. Source type plot based on Bowers and Hudson (1999). In this plot earthquake, explosion and collapse data from Ford et al. (2007) is compared to the August 6th event (red star). The August 6th event plots in the general moment tensor space that defines an closing crack, or collapse. The event is located well outside the region occupied by tectonic earthquakes.
Analysis of the sensitivity of the moment tensor solution to source depth indicates that shallow depths are preferred (Figure 7a). In this analysis 19 stations were used. The data was processed as described above. Depths of 600m, 800m and 1 km give similar levels of fit. The slight increase in fit from 2 to 3 km depth is likely due to the presence of a velocity discontinuity in the structure modeled used to compute the Green’s functions. Another very interesting result is that the moment tensor solution remains stable and strongly crack-like over the depth range from 600m to 5km (Figure 7b). Assumed sources at greater than 5 km depth become less crack-like, but also remain substantially different from a double-couple.

Acknowledgements
S.F.'s summer internship at LLNL is supported by the joint
project between
William R. Walter at LLNL and Doug Dreger at UCB under Department
of Energy BAA contract DE-FC52-06NA27324. This work was performed in part under
the auspices of the U.S. Department of Energy by
References
Bowers, D., and W. Walter (2002). Discriminating between large mine collapses and explosions using teleseismic P waves, PAGEOPH,
803-830.
Dreger, D. and B. Woods (2002). Regional distance seismic moment tensors of nuclear explosions;
seismic source mechanism through moment tensors, Tectonophysics,
356(1-3), 139-156.
Pechmann, J. C., W. R. Walter, S. J. Nava, and W.
J. Arabasz (1995). The February 3, 1995 ML 5.1
seismic event in the trona mining district of
southwestern
Sean R. Ford, Douglas S. Dreger,
and William R. Walter (2007) IDENTIFYING ISOTROPIC EVENTS USING AN IMPROVED
REGIONAL MOMENT TENSOR INVERSION TECHNIQUE, Monitoring Research Review, Denver,
CO.
Minson, S. and D. Dreger (2007). Improved seismic
moment tensor inversion, Geophys J. Int..
Song, X. J., D. V. Helmberger
and L. Zhao (1996). Broad-band modelling of regional
seismograms; the basin and range crustal structure, Geophys. J. Int., 125(1), 15-29.
Appendix A – Example of the Moment Tensor Inversion of the May 8,
2007 Alder
On May 8, 2007 a Mw4.4 event occurred near Alder Montana. This event was well recorded by 149 stations operated by several organizations (Figure A1). We used the data in the same way described above to determine the moment tensor of this event. The results shown in Figure A2 indicate the event is best characterized as a double-couple. The fit to the deviatoric (non-volumetric) source is 80%. Allowing a volumetric component increases the fit by 89% and introduces a small isotropic component. Both the deviatoric and full moment tensor models provide excellent fit to the data due to the dominant double-couple component in contrast to the case for the August 6 event.

Figure A1. Location of 8 May
07 event near Alder, MT (red star) and stations used
in the MT analysis (blue diamonds) along with those used in the subset analysis
(white square). All stations ~1000 km from the event are shown (small circles),
where the networks are TA (yellow), BK (orange), IM (red), IU (light orange),
US (green), UW (light blue). Inset, location on continental
US.

Figure A2. a) Data (grey)
and synthetics predicted by the solution using 149 stations (red) and 6
stations with an even azimuthal distribution for a deviatoric solution (green) and full solution (blue). b) Deviatoric focal mechanism where area is scaled by M0,
and source parameters for the 6-station solution c) Deviatoric
and isotropic component (with M0%), for the 6-station solution. c) Deviatoric focal mechanism and isotropic component for the
149-station solution. VR in title is the % variance reduction, a goodness of
fit measure.