CVS - Moon Mountain Vineyard, Sonoma, CA, USA
We operate broadband and borehole stations under the network code BK. The Berkeley Digital Seismic Network (BDSN) is a regional network of very broadband and strong motion seismic stations designed to monitor regional seismic activity as well as provide high quality data. The Berkeley borehole stations have borehole geophones or other seismic sensors and may have other geophysical instrumentation.
| Station Name | CVS |
| In Operation | 1998/05/06 00:00:00 - Present |
| Latitude | |
| Longitude: | |
| Elevation: | 295.1 meters |
| Instrumentation | Broadband |
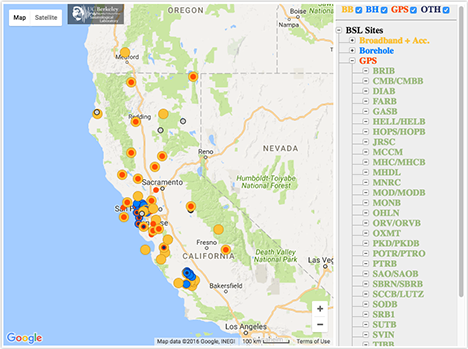
Location
Site is located at Moon Mountain Vineyard in Sonoma Valley.Network
Berkeley Digital Seismic Network (BK)Geology
Tuff
Borehole Conditions
The seismometers are installed in a tunnel that is part of the Moon Mountain Vineyard wine cellars.Station Pictures
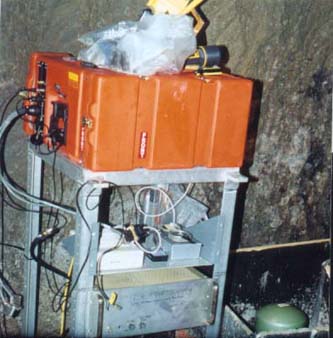
Site of CVS vault |
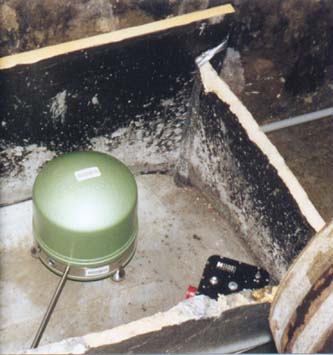
STS-2 installation at CVS |
Table of Seismic Instrumentation
| Sensor | Datalogger | SEED Channels | Location | |
| Broadband | Streckeisen STS-2 VBB Tri-Axial Seismometer | Q330HR | BH?,HH?,LH?,VH? | 00 |
| Accelerometer | Kinemetrics FBA ES-T Accel. (4 g max 5 v/g) | Q330HR | HN? | 00 |
| Auxiliary | AntennaCurrent | Q330HR | VE? | 00 |
| ClockPhase | Q330HR | LC?,VC? | 00 | |
| ClockQuality | Q330HR | LC?,VC? | 00 | |
| InputVoltage | Q330HR | VE? | 00 | |
| SystemCurrent | Q330HR | VE? | 00 | |
| SystemTemperature | Q330HR | VK? | 00 | |
| VCOValue | Q330HR | VC? | 00 |
Waveforms and associated metadata are available at the Northern California Earthquake Data Center (NCEDC).
Waveform Data
- BK Information Directory, including
- List of station locations
- List of available channels
- Instrument Response
- Querying the archives
- Download waveform data