HUMO - Hull Mountain, OR, USA
We operate broadband and borehole stations under the network code BK. The Berkeley Digital Seismic Network (BDSN) is a regional network of very broadband and strong motion seismic stations designed to monitor regional seismic activity as well as provide high quality data. The Berkeley borehole stations have borehole geophones or other seismic sensors and may have other geophysical instrumentation.
| Station Name | HUMO |
| In Operation | 2002/06/18 00:00:00 - Present |
| Latitude | |
| Longitude: | |
| Elevation: | 554.9 meters |
| Instrumentation | Broadband |
Location
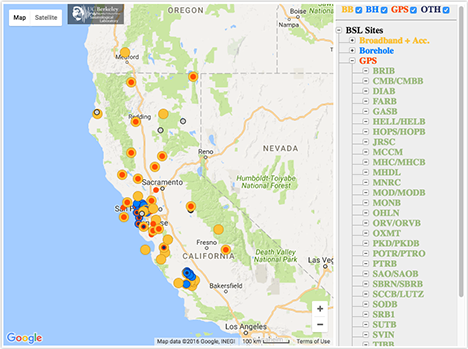
Site is located on BLM land on Hull Mountain, Oregon.HUMO is a cooperative station with the Advanced National Seismic System and the Global Seismic Network.
Network
Berkeley Digital Seismic Network (BK)Geology
Payne Cliffs formation - sandstone and siltstone
Borehole Conditions
The equipment is located in a side adit of a hard-rock mine approximately 100 meters from the entrance. Overburden is approximately 50 meters. The sensors are located on a concrete pier covered with 4" of rigid foam insulation.The datalogger, dial-up modem, and fiber optic modems are located in a plastic garden shed about 8 meters from the pier. Batteries are located in a large plastic storage box next to the shed. The tunnel entrance is covered with a hinged steel grate to allow free passage of bats. Humidity is 100% outside the enclosures. Telemetry is through 300 meters of fiber optic cable connected to a satellite system.
Station Pictures
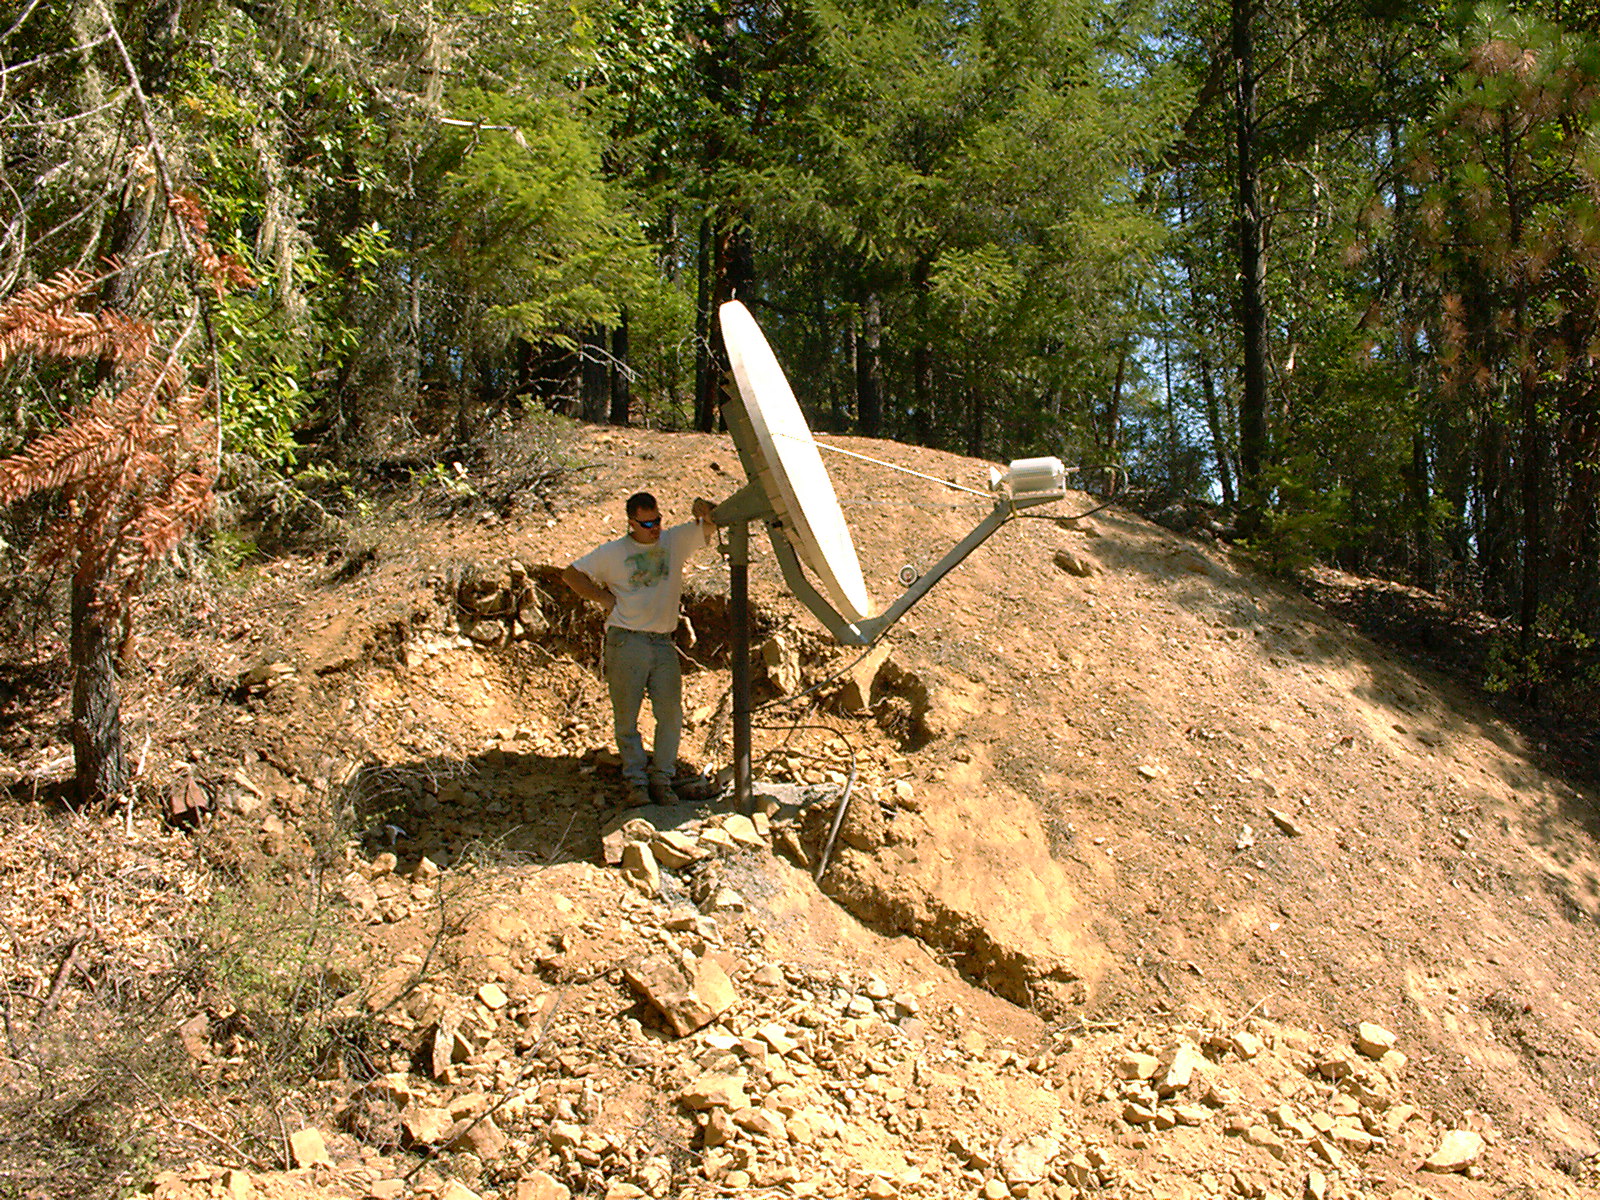
NSN VSAT at HUMO |
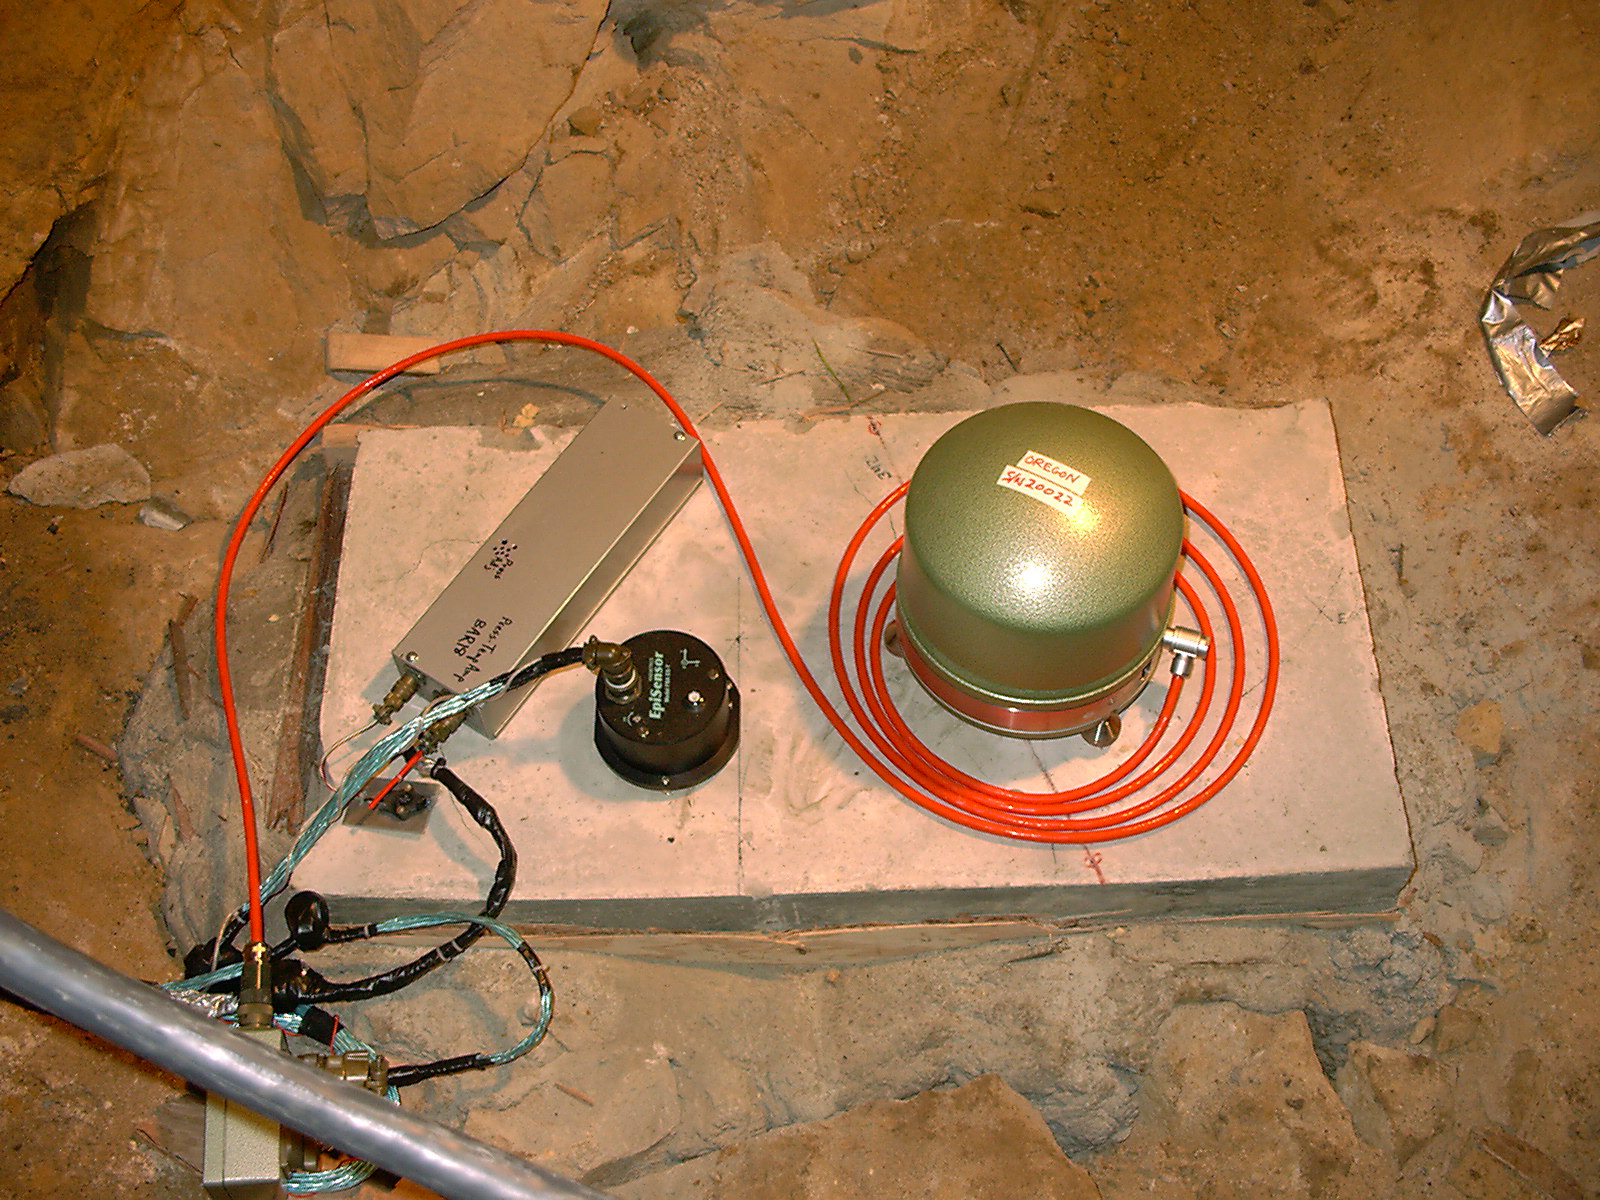
STS-2 at HUMO |
Table of Seismic Instrumentation
| Sensor | Datalogger | SEED Channels | Location | |
| Broadband | Streckeisen STS-2 VBB Tri-Axial Seismometer | Q330HR-GFE | BH?,HH?,LH?,VH? | 00 |
| Accelerometer | Kinemetrics FBA ES-T Accel. (2 g max 10 v/g) | Q330HR-GFE | HN? | 00 |
| Auxiliary | AntennaCurrent | Q330HR-GFE | VE? | 00 |
| ClockPhase | Q330HR-GFE | LC?,VC? | 00 | |
| ClockQuality | Q330HR-GFE | LC?,VC? | 00 | |
| InputVoltage | Q330HR-GFE | VE? | 00 | |
| SystemCurrent | Q330HR-GFE | VE? | 00 | |
| SystemTemperature | Q330HR-GFE | VK? | 00 | |
| VCOValue | Q330HR-GFE | VC? | 00 |
Waveforms and associated metadata are available at the Northern California Earthquake Data Center (NCEDC).
Waveform Data
- BK Information Directory, including
- List of station locations
- List of available channels
- Instrument Response
- Querying the archives
- Download waveform data