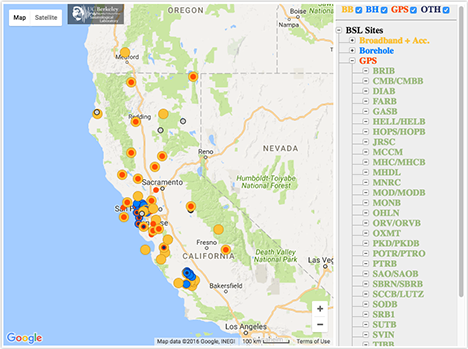
MOBB - Monterey Bay Ocean Bottom, CA, USA
We operate broadband and borehole stations under the network code BK. The Berkeley Digital Seismic Network (BDSN) is a regional network of very broadband and strong motion seismic stations designed to monitor regional seismic activity as well as provide high quality data. The Berkeley borehole stations have borehole geophones or other seismic sensors and may have other geophysical instrumentation.
| Station Name | MOBB |
| In Operation | 2002/04/10 18:43:00 - Present |
| Latitude | |
| Longitude: | |
| Elevation: | -1036.5 meters |
| Instrumentation | Broadband |
Location
Site is located on the Monterey Bay ocean floor, Monterey, CA. The station is operated as a collaborative effort with Monterey Bay Aquarium Research Institute (MBARI). As of 2/27/09, there is an umbilical connecting MOBB to the MARS research node. Data is sent from the node to MBARI via the MARS cable and is then sent back to the Berkeley Seismological Laboratory through the Internet in real time.
- Monterey Ocean Bottom Broadband (MOBB) Project
- Seismo blog entries on the MOBB installation
The MOBB station has been down since July 2017 due to a failure of the extension cable that links it to the main MARS cable and provides access to the data as well as power to the instruments. As of March 14, 2018, we are still looking for ways to determine the extent of the failure (i.e. whether the whole cable needs to be replaced)
Network
Berkeley Digital Seismic Network (BK)Geology
Borehole Conditions
Station Pictures
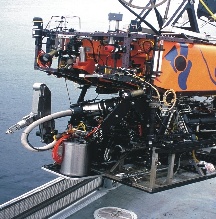
ROV being deployed to MOBB |

Filling the MOBB seismometer |
Table of Seismic Instrumentation
| Sensor | Datalogger | SEED Channels | Location | |
| Broadband | Guralp CMG-1T Triaxial Seismometer | DM24 | BH? | 00 |
| Others | Deep-Sea Differential Pressure Gauge | Q330 | LD? | 10 |
| Falmouth Scientific Inc. 2D Acoustic Current Meter | FSI2DACM | LO? | 20 | |
| Auxiliary | 12V Monitor | Q330 | LE? | 10 |
| BufferUsage | Q330 | VF? | 10 | |
| ClockPhase | Q330 | LC? | 10 | |
| ClockQuality | Q330 | LC? | 10 | |
| InputVoltage | Q330 | VE? | 10 | |
| SystemCurrent | Q330 | VE? | 10 | |
| SystemTemperature | Q330 | VK? | 10 | |
| VCOValue | Q330 | VC? | 10 |
Waveforms and associated metadata are available at the Northern California Earthquake Data Center (NCEDC).
Waveform Data
- BK Information Directory, including
- List of station locations
- List of available channels
- Instrument Response
- Querying the archives
- Download waveform data