SUTB - Sutter Buttes
We operate broadband and borehole stations under the network code BK. The Berkeley Digital Seismic Network (BDSN) is a regional network of very broadband and strong motion seismic stations designed to monitor regional seismic activity as well as provide high quality data. The Berkeley borehole stations have borehole geophones or other seismic sensors and may have other geophysical instrumentation.
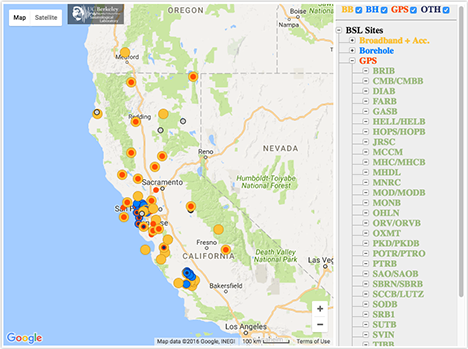
BARD is our GPS network for monitoring crustal deformation across the Pacific-North America plate boundary and in the San Francisco Bay Area for earthquake hazard reduction studies and rapid earthquake emergency response assessment
| Station Name | SUTB (SUTB) |
| In Operation | 1997-03-27 14:29:00 -0800 - Present |
| Latitude | |
| Longitude: | |
| Elevation: | 616.5437 meters |
| Instrumentation | Broadband GPS |
Location
Site is located at Sutter Buttes in Sutter, CA.
This station was installed in May 2005 by USArray personnel as a collaboration with the Berkeley Seismological Laboratory, and was part of the USArray component of the Earthscope program. When the Travelling Array left California in 2007, the BSL adopted this station. It has been operating as a BDSN station since May 2008.
Network
Berkeley Digital Seismic Network (BK)Bay Area Regional Deformation Network Network (BARD)
Geology
Franciscan Complex, Cretaceous and Jurassic sandstone
Borehole Conditions
The SUTB installation is based on the USArray vault design.GPS Monument Description
Antenna mount is embedded in bedrock.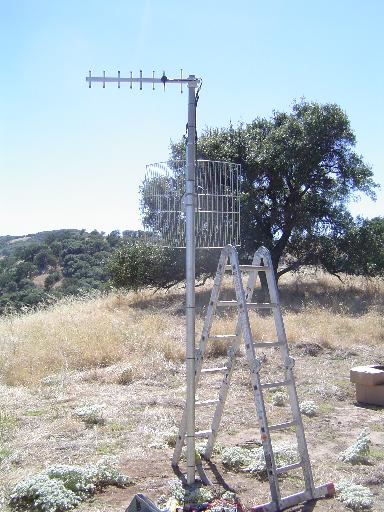
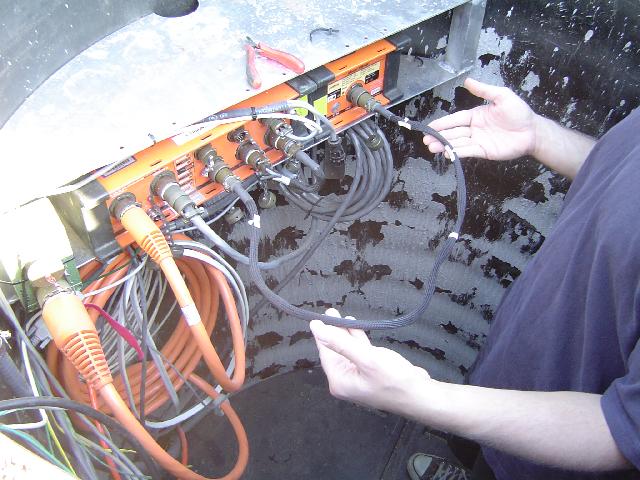
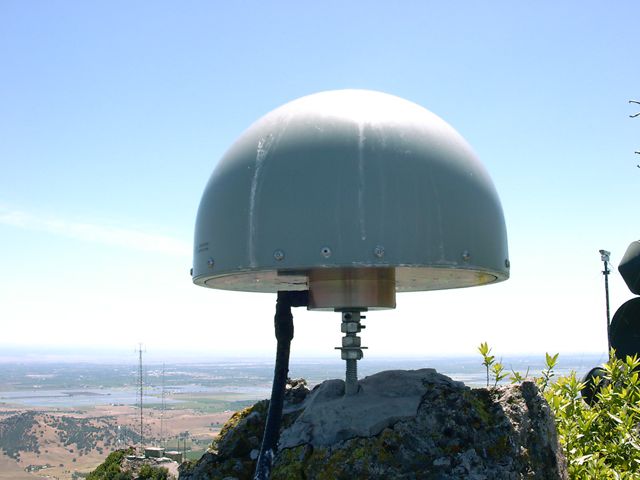
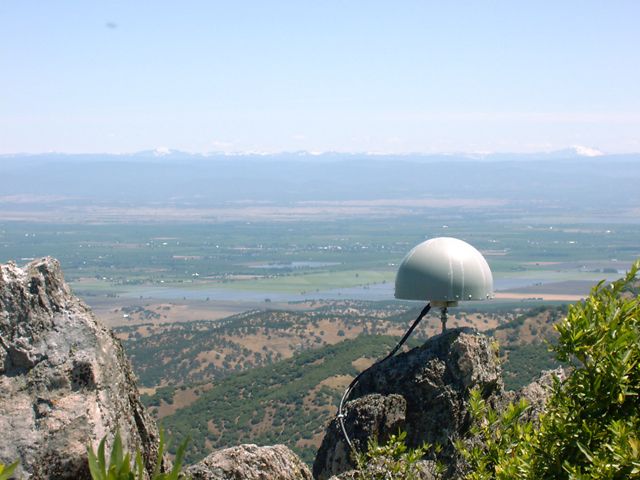
Table of Seismic Instrumentation
| Sensor | Datalogger | SEED Channels | Location | |
| Broadband | MBB-2 | Q330HR | BH?,HH?,LH?,VH? | 01 |
| Accelerometer | EPISENSOR ES-T | Q330HR | HN? | 01 |
GPS Instrumentation
| Receiver | Antenna | Radome | - | |
| GPS | SEPTENTRIO POLARX5 | ASHTECH ASH700936C_M | SCIS | - |
Waveforms and associated metadata, and GPS data, are available at the Northern California Earthquake Data Center (NCEDC).
Waveform Data
- BK Information Directory, including
- List of station locations
- List of available channels
- Instrument Response
- Querying the archives
- Download waveform data
GPS Data
- Site log: sutb.log
Data Type From To Low-rate raw 03/27/1997 3/11/2010 Low-rate rinex 03/27/1997 present High-rate raw 3/11/2010 present High-rate rinex 5/1/2010 present
Noise Analysis
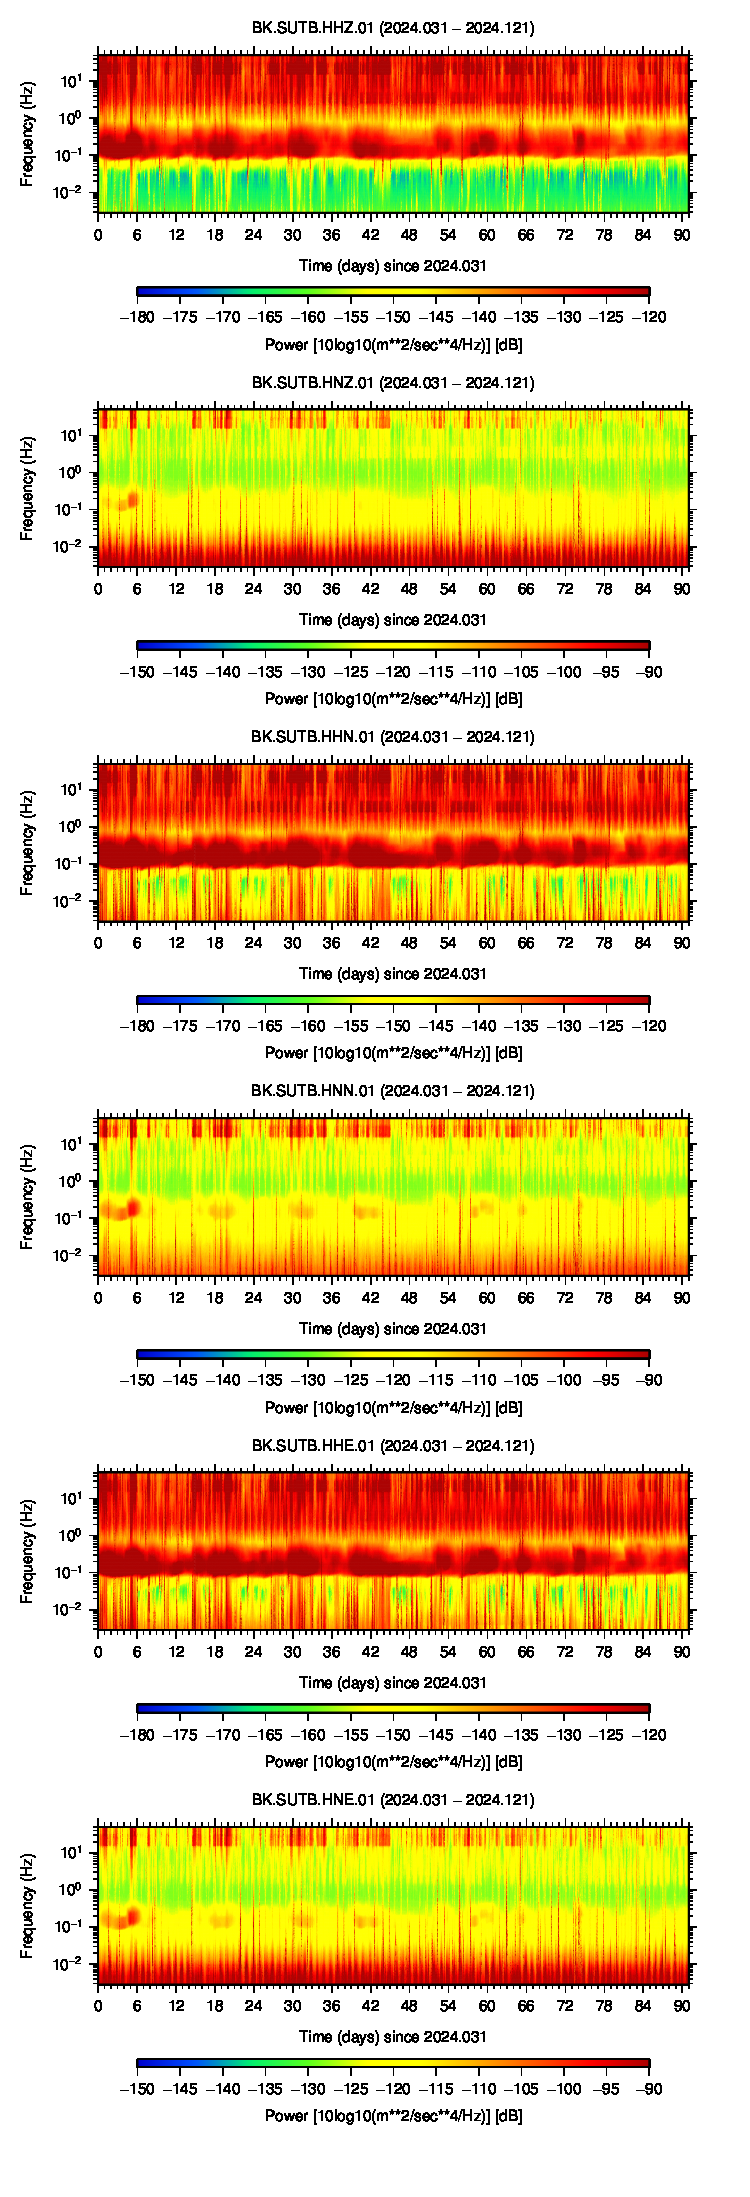 |
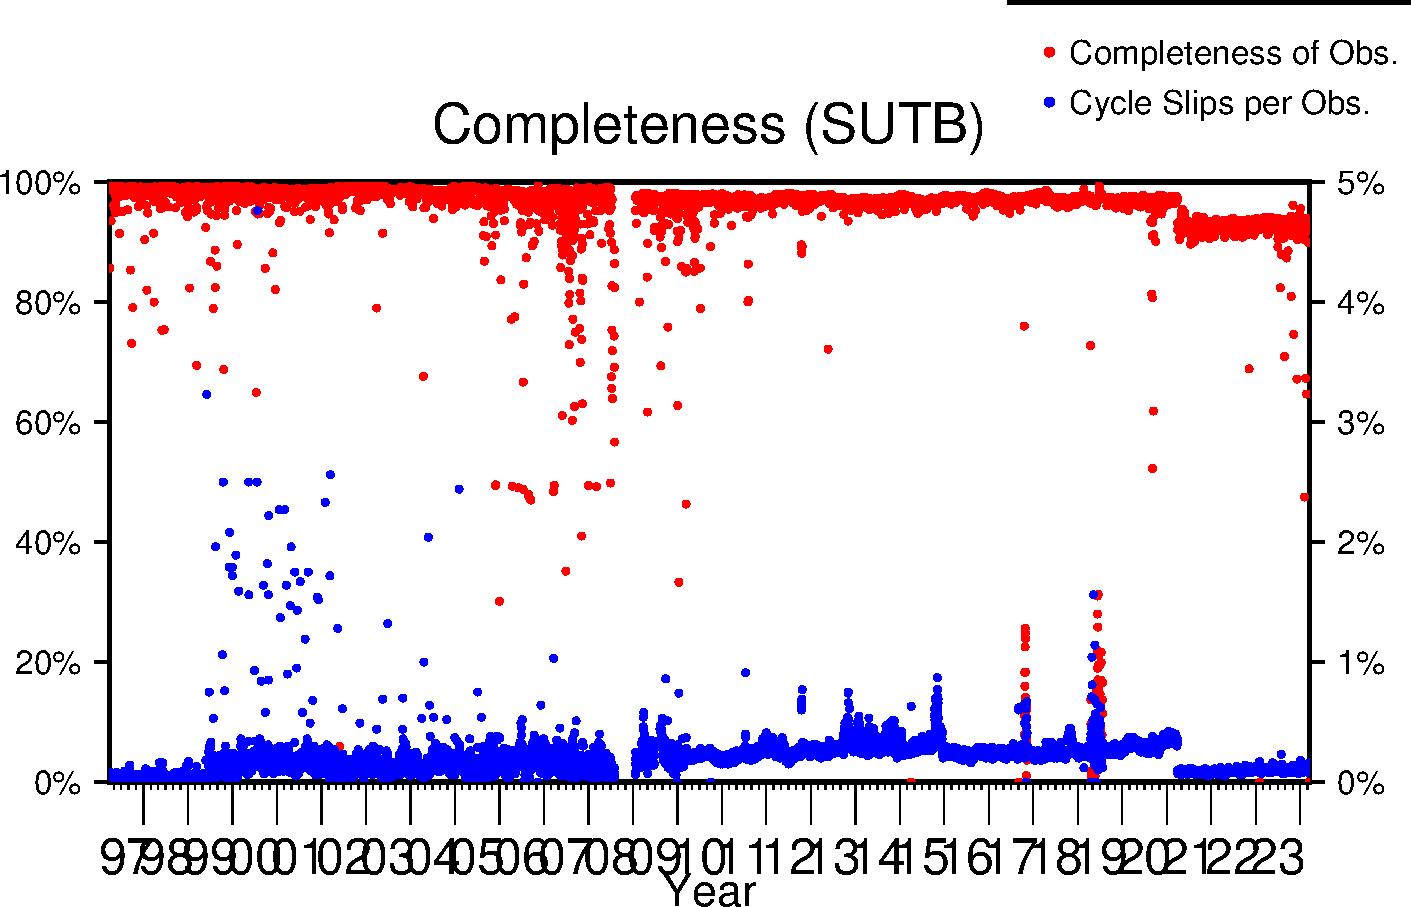
GPS Data Quality
Completeness
Data completeness is defined both as "Completeness of observations" and "Cycle slips per observation". "Completeness of Obs." is the number of epochs in the final RINEX file normalized to the expected number. This percentage will go down if time is missing from the RINEX file. "Cycle slips per Obs." is the total number of detected cycle slip normalized to the total number of observations in the RINEX file. This number will increase as the receiver loses lock on satellites more frequently.
| Previous Year |
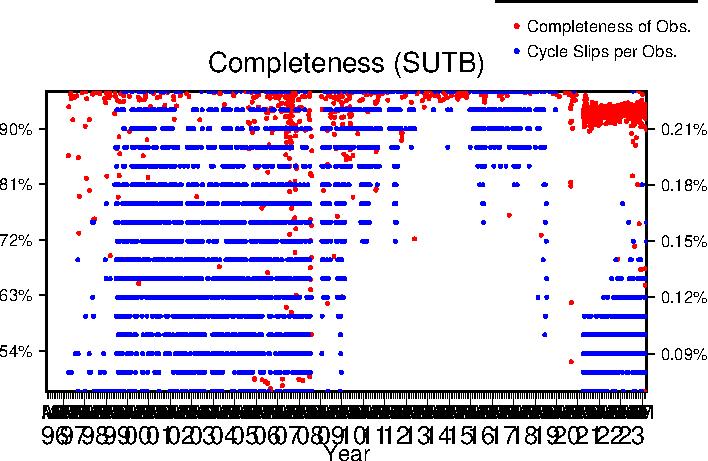 |
| Lifetime |
 |
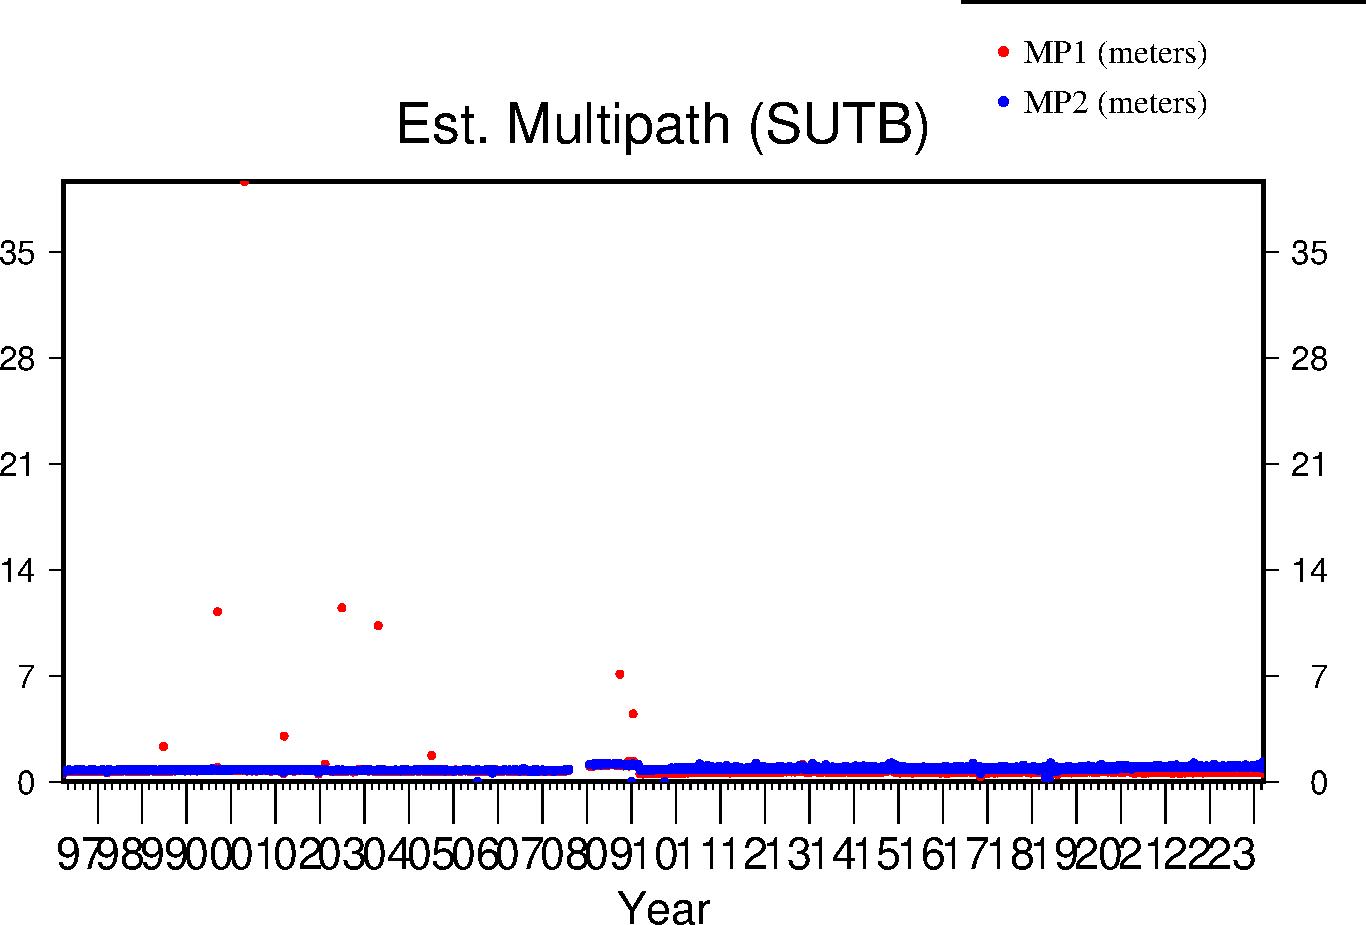
Multipath
The effects of multipath on the data are estimated by parameters for L1 and L2 (MP1 and MP2 respectively); see Estey and Meertens (GPS Solutions, 1999) for derivation. The daily value is the RMS of MP1 and MP2 throughout the day and for all satellites. Higher values indicate a greater prevalence and/or strength of multipathing, i.e. objects on the ground are providing multiple reflection pathways from the satellite to antenna.
| Previous Year |
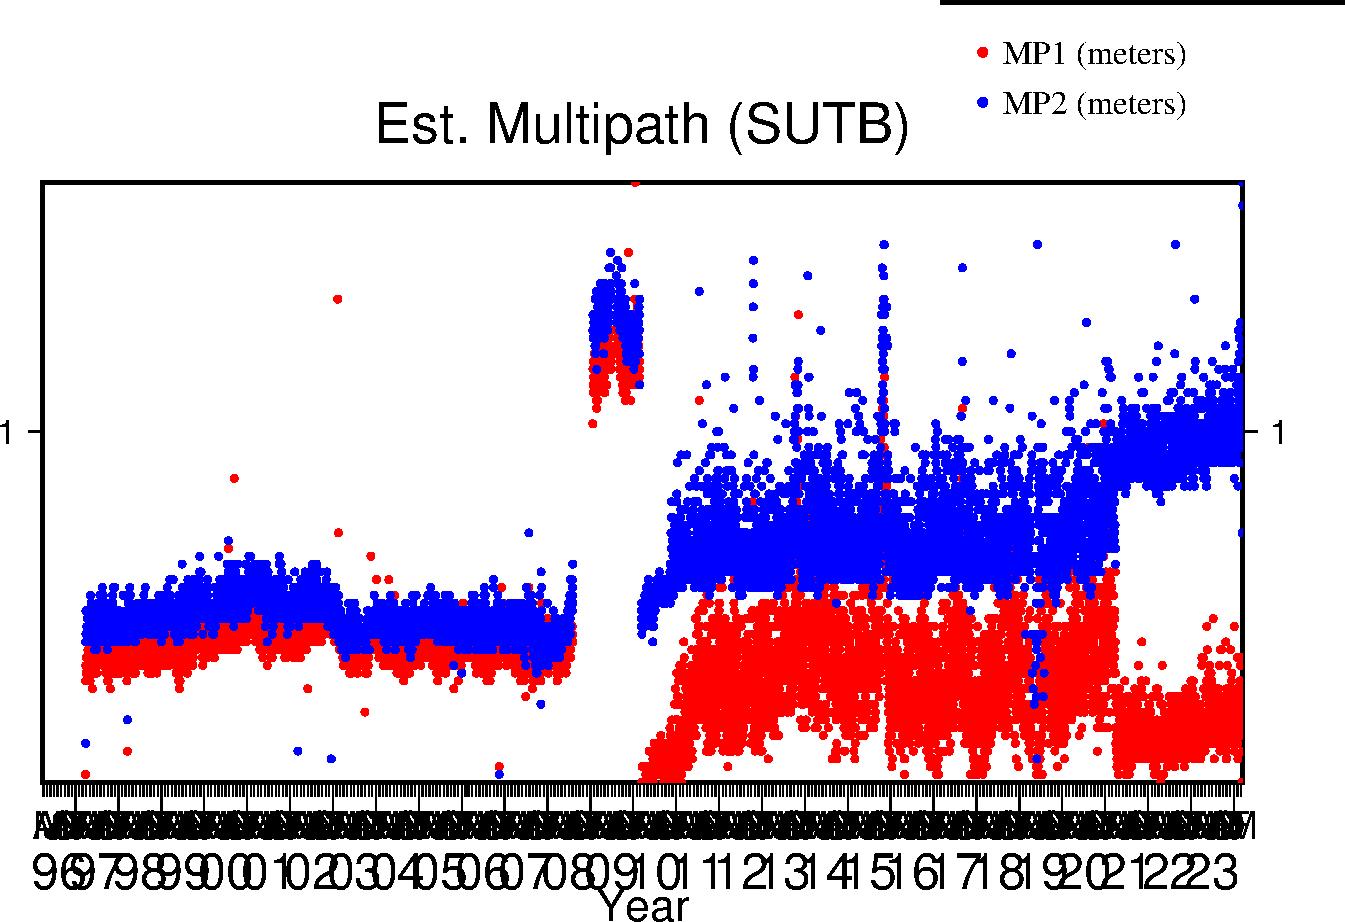 |
| Lifetime |
 |
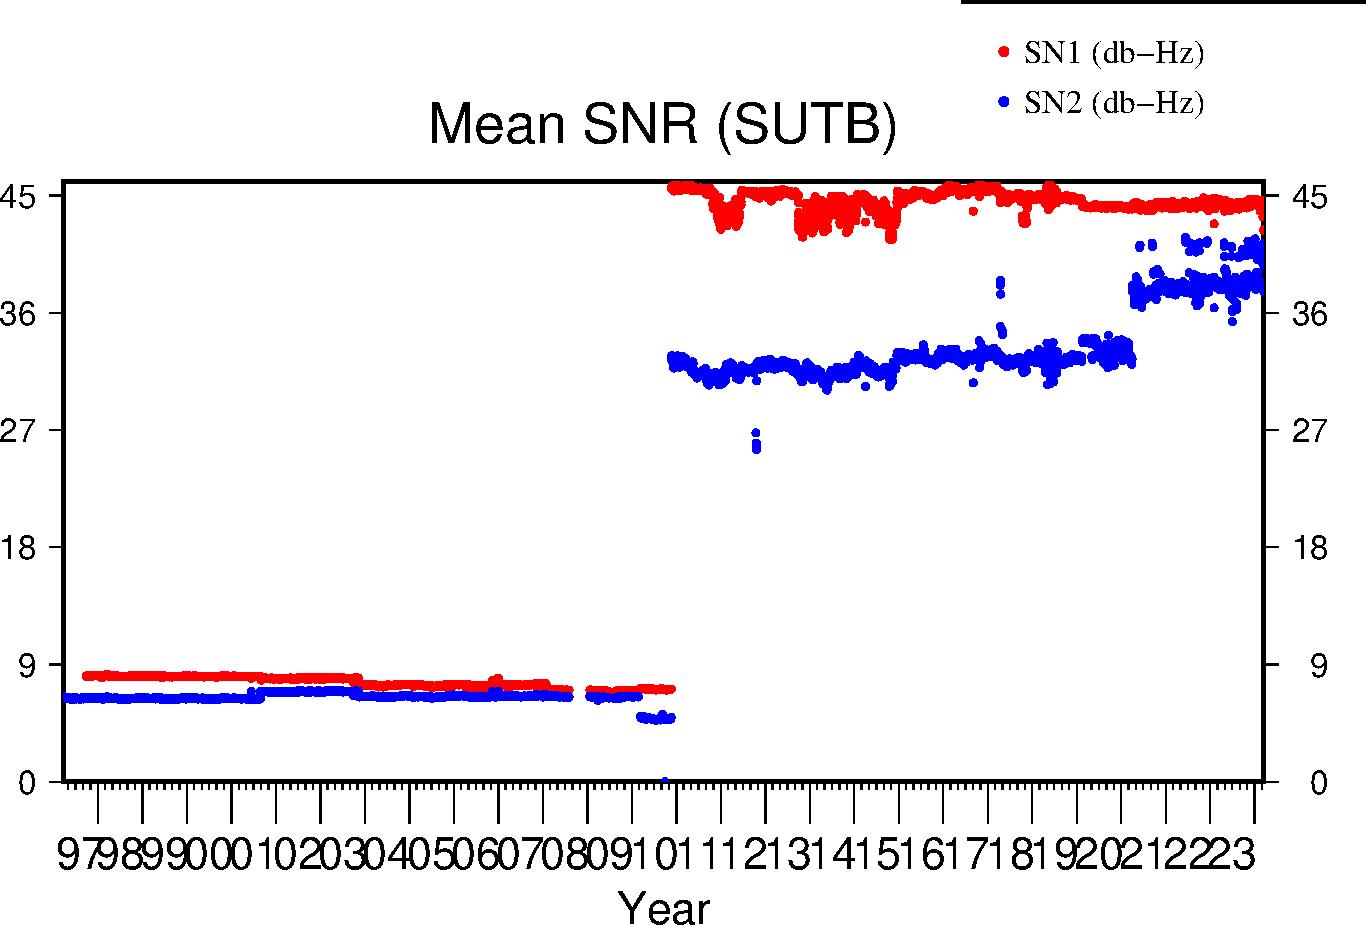
Signal-to-Noise Ratio
The Signal-to-Noise ratios are the mean values above the QC elevation mask for L1 and L2 respectively.
| Previous Year |
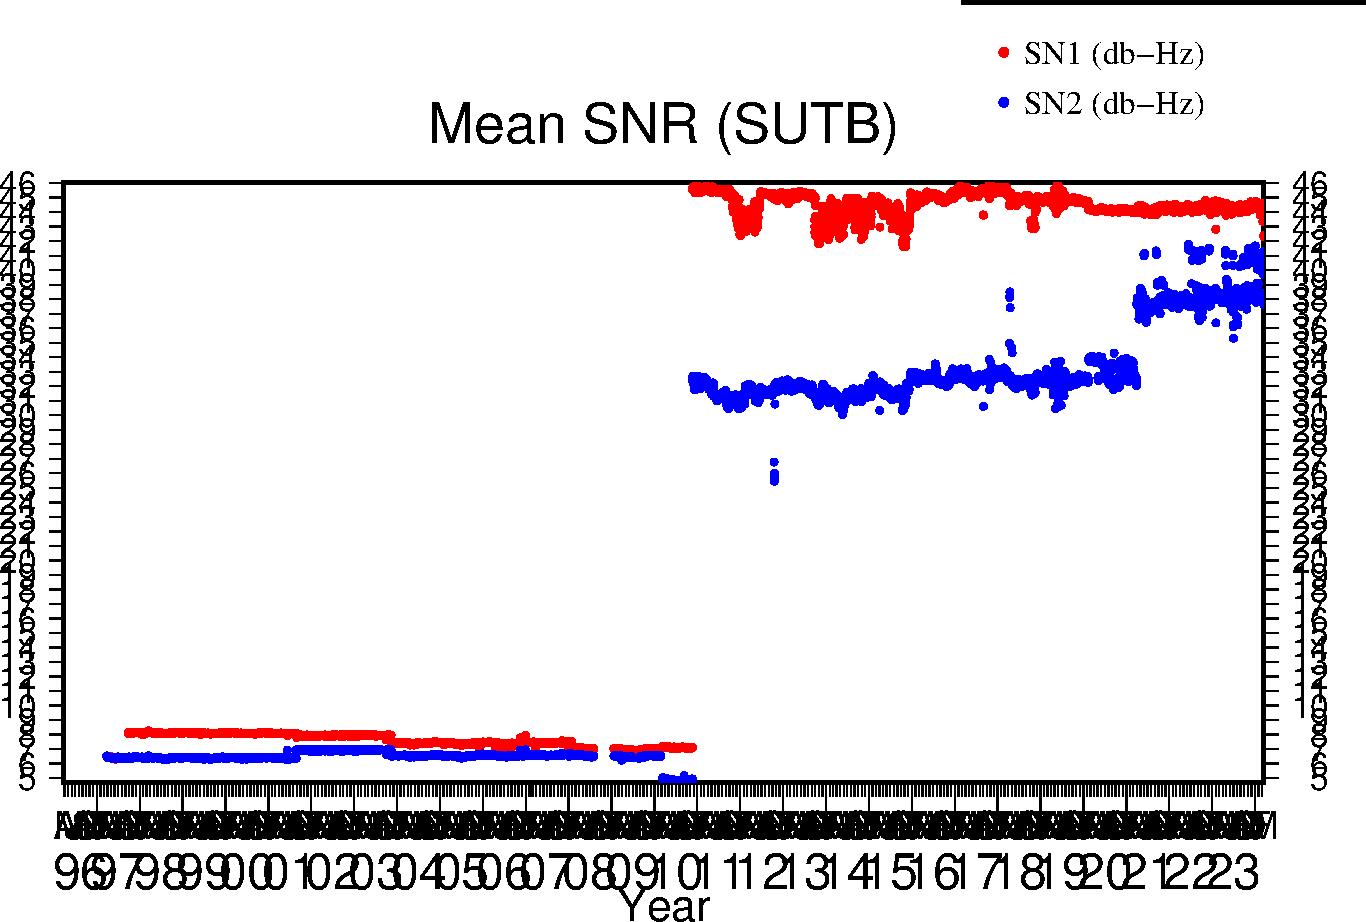 |
| Lifetime |
 |