Seismo Blog
How to Read a Seismogram
Categories: Irian Jaya | Seismogram | Instrumentation | Teleseismic Waves | Seismic Waves
January 14, 2009
It is often said that seismologists use earthquake waves to illuminate the interior of the Earth like a radiologist uses X-rays to study the insides of the human body. There is indeed some similarity, as both of these branches of physics are of the same age. The German researcher Wilhelm Conrad Röntgen took his first X-ray photograph in 1896 (see picture 1). Roughly at the same time, the first seismographs were installed and earthquake researchers learned to read the "trembling of the rock" (see blog January 9, 2009).

Picture 1: The first X-ray photograph
In a strict physical sense, however, major differences exist between X-ray pictures and seismograms. Through the different shades of grey in the X-ray picture one can clearly distinguish between the wedding ring, the bones, and the soft tissue in the hand. This is due to the fact that metal, the calcium structure of the bone, and the soft tissue absorb electromagnetic waves differently. Metals swallow X-rays almost completely, but the calcium in the bones is not quite as opaque as metal, while the soft tissue lets most of the rays pass.
Although seismic waves experience some absorption in the rocks of the Earth, it is by no means the dominant feature in a seismogram. Look at picture 2. It is a recording of the magnitude 7.6 earthquake in eastern Indonesia on January 4, 2009 (see blog January 5, 2009). The blue line represents 40 minutes of ground movement at our seismic station "CMB" in Columbia in Tuolumne County. Starting from the left, it begins as an almost straight line. Then, roughly at 19:57 UTC, the ground starts to wiggle. There is another shaking at minute 20:02 UTC, a bigger one at 20:12, and an even larger one at 20:17, with the biggest one at 20:31. Each of the arrows marks one of these "onsets" or "phases," as seismologists call them.
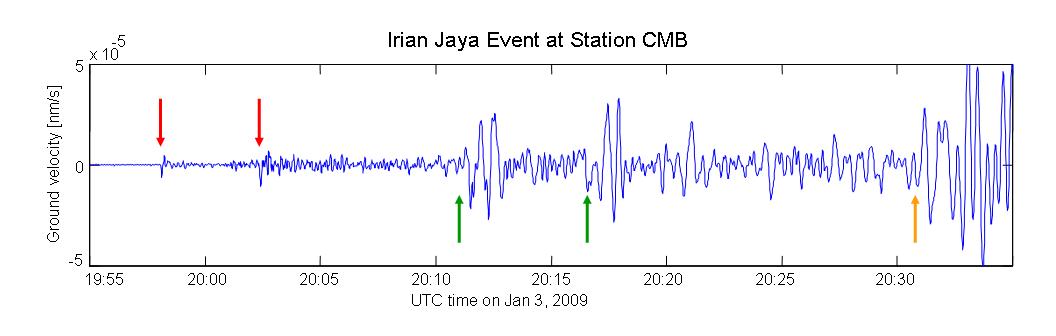
Picture 2: Seismogram showing M 7.6 earthquake in West Irian Jaya.
What are these phases? As the seismic waves travel from the earthquake focus through the earth, they hit major boundary layers in its interior. At each of such "discontinuities" the waves are reflected, refracted or diffracted. Each of these processes alters the path of the waves, which in turn makes them travel longer until they reach CMB. In addition, different kinds of waves travel through the Earth with different velocities. The P-waves (red arrows) are faster than the S-Waves (green arrows) (see also blog September 10, 2008). In one of the next blogs, we will explore, how these phases can be used to "X-ray" the Earth's interior. (hra027)
BSL Blogging Team: Who we are
Recent Posts
-
: Alerts for the Whole West Coast
-
: Destruction in the Eastern Aegean Sea
-
: An Explosion in Beirut heard all over the Middle East
View Posts By Location
Categories
- Alaska (3)
- Bay Area (24)
- Buildings (3)
- Calaveras (4)
- California (13)
- California ShakeOut (3)
- Central California (4)
- Chile (4)
- Earthquake Early Warning (10)
- Earthquake Faults and Faulting (44)
- Earthquake Science (3)
- Haiti (3)
- Hayward (12)
- Indonesia (4)
- Induced Seismicity (3)
- Instrumentation (18)
- Italy (6)
- Japan (7)
- MOBB (3)
- Mendocino Triple Junction (5)
- Mexico (7)
- Nepal (3)
- North Korea (5)
- Nuclear Test (5)
- Ocean Bottom Seismometer (3)
- Oklahoma (4)
- Plate Tectonics (18)
- Preparedness, Risks, and Hazards (16)
- Salton Sea (3)
- San Andreas Fault (14)
- Seismic Waves (13)
- Seismograms (4)
- ShakeAlert (3)
- Southern California (5)
- Surface Waves (3)
- Today in Earthquake History (20)
- Volcanoes (4)
- subduction (3)