Seismo Blog
Another Kind of Earthquake Wave
Categories: Italy | INSAR | Instrumentation
April 17, 2009
Earthquakes make waves. That's a trivial, commonplace statement, given the fact that seismic waves can violently shake the ground and topple buildings. But there is another kind of wave generated by temblors, which can only be seen after heavy numerical manipulation of the data from certain types of satellites.

Fig 1 (oil film). Photo: Horst Rademacher
Here is how it works: About a half dozen of the satellites currently circling the earth continuously send out radar beams to probe the Earth's surface. They have a separate sensor on board which registers the radar beam's reflection off the ground. The primary mission of these "Synthetic Aperture Radars" (SAR) is to exactly map the altitude of the surface with a precision of one half inch or less. To the delight of earth scientists, the radar sensors have an additional benefit. Every few weeks, the satellite path repeats. That means it passes over the same regions of the Earth in the same order. It is then possible to detect slight changes in the elevation of the Earth's surface which have occurred from one fly-over to the next.
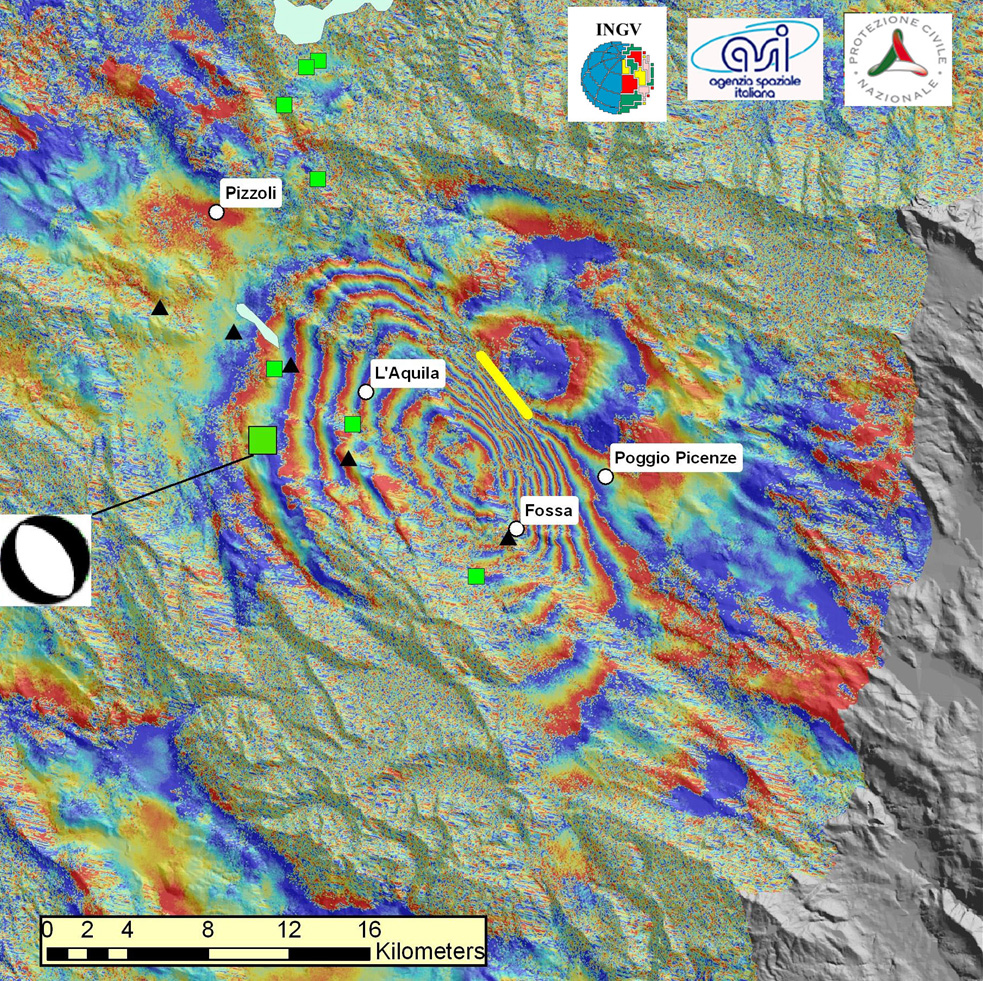
Fig 2 (InSAR), Map courtesy of INGV and ESA (Click to view larger image.)
Let's apply this to seismology: The European satellite "Envisat," which carries a SAR sensor, flew over the Abruzzo region of Central Italy on February 1, 2009 and then again six weeks later on April 12. In the mean time, a devastating earthquake occurred near the town of L'Aquila, killing more than 260 people (see blog April 6, 2009). Italian scientists compared the radar pictures taken during the two successive orbits using a numerical technique called "Interferometry," essentially subtracting one picture from the other. The result is a map of colored waves, similar to the iridescent patterns one can see on a soap bubble or when an oil film covers a puddle (see Fig 1). Just as a physicist can use these color patterns to determine the thickness of the oil film or the bubble walls, Earth scientists can interpret the maps. Each colored ring is a measure of how much the ground has moved as a result of the earthquake. In this case, each ring represents a movement of just over an inch.
Figure 2 shows this pattern for the Abruzzo quake. The large green square represents the location of the main shock; the smaller green squares show large aftershocks. Along the yellow line east of
L’Aquila geologists found an alignment of surface breaks after the quake, which indicate the orientation of the rupture. The colored wave pattern follows those breaks exactly, indicating that the ground had moved a total of seven inches down to the left side of the yellow line. This movement is also represented by the black and white fault plane solution on the left. More on these "beach balls" in one of the next blogs. (hra037)
BSL Blogging Team: Who we are
Recent Posts
-
: Alerts for the Whole West Coast
-
: Destruction in the Eastern Aegean Sea
-
: An Explosion in Beirut heard all over the Middle East
View Posts By Location
Categories
- Alaska (3)
- Bay Area (24)
- Buildings (3)
- Calaveras (4)
- California (13)
- California ShakeOut (3)
- Central California (4)
- Chile (4)
- Earthquake Early Warning (10)
- Earthquake Faults and Faulting (44)
- Earthquake Science (3)
- Haiti (3)
- Hayward (12)
- Indonesia (4)
- Induced Seismicity (3)
- Instrumentation (18)
- Italy (6)
- Japan (7)
- MOBB (3)
- Mendocino Triple Junction (5)
- Mexico (7)
- Nepal (3)
- North Korea (5)
- Nuclear Test (5)
- Ocean Bottom Seismometer (3)
- Oklahoma (4)
- Plate Tectonics (18)
- Preparedness, Risks, and Hazards (16)
- Salton Sea (3)
- San Andreas Fault (14)
- Seismic Waves (13)
- Seismograms (4)
- ShakeAlert (3)
- Southern California (5)
- Surface Waves (3)
- Today in Earthquake History (20)
- Volcanoes (4)
- subduction (3)