Seismo Blog
Forecast - Not Prediction
Categories: California |
March 16, 2015
If we Californians didn't know that we are living in earthquake country, and that the question is not "if" but "when" the next Big One will occur, one could become really frightened by the details which went into the latest earthquake forecast model, published last week . The researchers involved in setting up the model used more than 250,000 earthquake scenarios on a total of 350 fault segments to compute where significant shakers are likely to occur in the state during the next 30 years. The computations are so complex that it would have taken a regular desktop computer roughly eight years of continuous number crunching to yield a result. In order not to be outrun by the forecast quake, the scientists used a supercomputer instead, which computed each model in less than an hour.
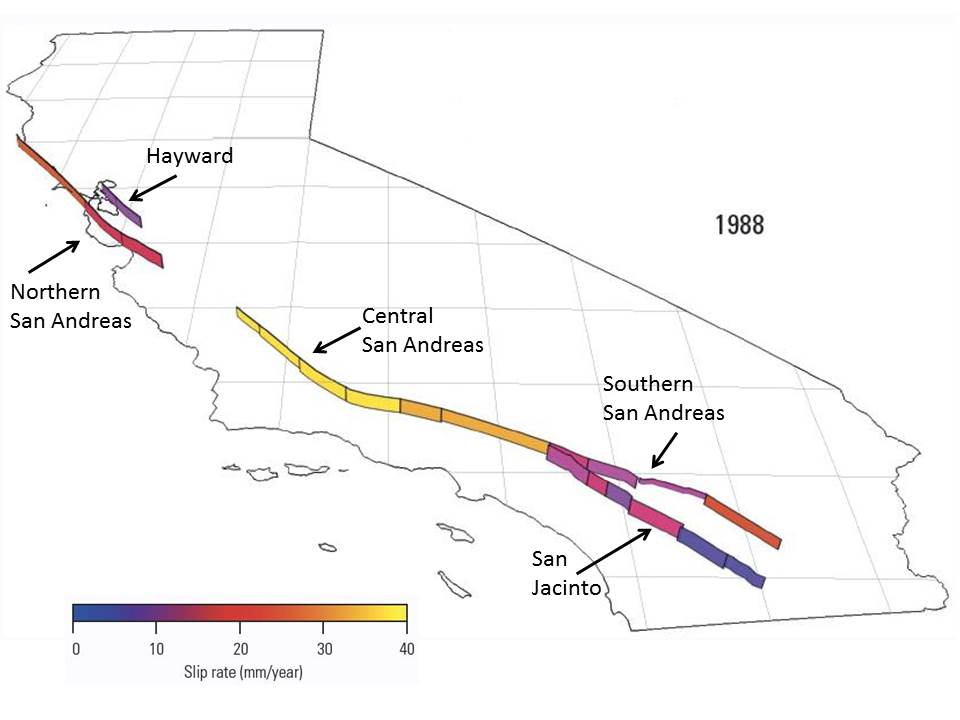
Figure 1 ( Adapted from WGCEP, 1988 )
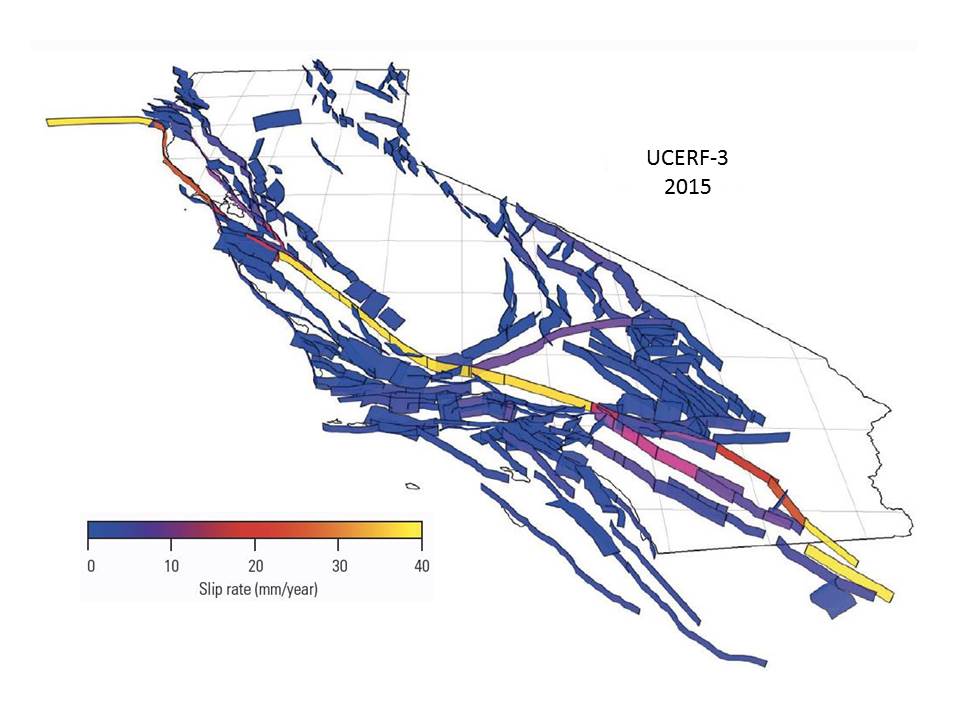
Figure 2 ( Adapted from UCERF-3 )
But despite its enormous detail, the latest "Uniform California Earthquake Rupture Forecast" (UCERF-3) is still a forecast and by no means an earthquake prediction. When talking about the weather, most people in casual conversations don't distinguish between the two terms anymore, forecast and prediction. But when you look closely at the bulletins about future weather issued by the National Weather Service (NWS) you will see the difference. The NWS folks never say "that it will rain exactly 2 inches at Fisherman's Wharf starting at 3 pm tomorrow". That would be prediction. Instead their bulletins read that there will be a 90 percent chance of significant rain at the northern end of the Peninsula in the next 24 hours - which is a forecast.
Such distinctions must also be made in seismology. A meaningful earthquake prediction has to fulfill three criteria: One has to forecast exactly where, when and with what magnitude an earthquake will strike. Despite considerable research efforts in many countries over in recent decades, nobody anywhere has succeeded in getting all three of those criteria consistently right. Hence: The prediction of earthquakes is still an elusive goal. But forecasts like UCERF-3 are the next best thing. The main reason for that is precisely the large amount of detail mentioned earlier: Over the years these rupture forecast models have become much more reliable and should therefore be taken quite seriously.
One example of the improvement is the number of California faults, which are the basis of the models. Figure 1 shows all of the handful of faults used for the first such calculations in 1988 - one year before the magnitude 6.9 Loma Prieta Earthquake ruptured part of the Northern San Andreas Fault. The faults are colored to show the different rates at which their flanks are moving past each other. Yellow is the highest speed with about 1.5 inches per year. Compare this with Figure 2, which shows all the faults and subfaults on which the latest forecast is based. It is much more detailed than the model from almost 30 years ago.
Another reason for the improvement in the forecasts is that seismologists have learned much more about the actual processes taking place during an earthquake. Until recently, nobody could imagine that a rupture during a temblor could jump from one fault to a neighbor. But modern techniques which use seismic waves to illuminate the actual breaking of the rock have shown that such jumps happen regularly - resulting in stronger and more extended earthquakes than previously thought possible. In the next blog, we will look in more detail at the forecast for the faults in our local Bay Area. (hra098)
BSL Blogging Team: Who we are
Recent Posts
-
: Alerts for the Whole West Coast
-
: Destruction in the Eastern Aegean Sea
-
: An Explosion in Beirut heard all over the Middle East
View Posts By Location
Categories
- Alaska (3)
- Bay Area (24)
- Buildings (3)
- Calaveras (4)
- California (13)
- California ShakeOut (3)
- Central California (4)
- Chile (4)
- Earthquake Early Warning (10)
- Earthquake Faults and Faulting (44)
- Earthquake Science (3)
- Haiti (3)
- Hayward (12)
- Indonesia (4)
- Induced Seismicity (3)
- Instrumentation (18)
- Italy (6)
- Japan (7)
- MOBB (3)
- Mendocino Triple Junction (5)
- Mexico (7)
- Nepal (3)
- North Korea (5)
- Nuclear Test (5)
- Ocean Bottom Seismometer (3)
- Oklahoma (4)
- Plate Tectonics (18)
- Preparedness, Risks, and Hazards (16)
- Salton Sea (3)
- San Andreas Fault (14)
- Seismic Waves (13)
- Seismograms (4)
- ShakeAlert (3)
- Southern California (5)
- Surface Waves (3)
- Today in Earthquake History (20)
- Volcanoes (4)
- subduction (3)