Seismo Blog
Today in Earthquake History: Oldest Seismogram 1881
Categories: Today in Earthquake History | Instrumentation
March 8, 2018
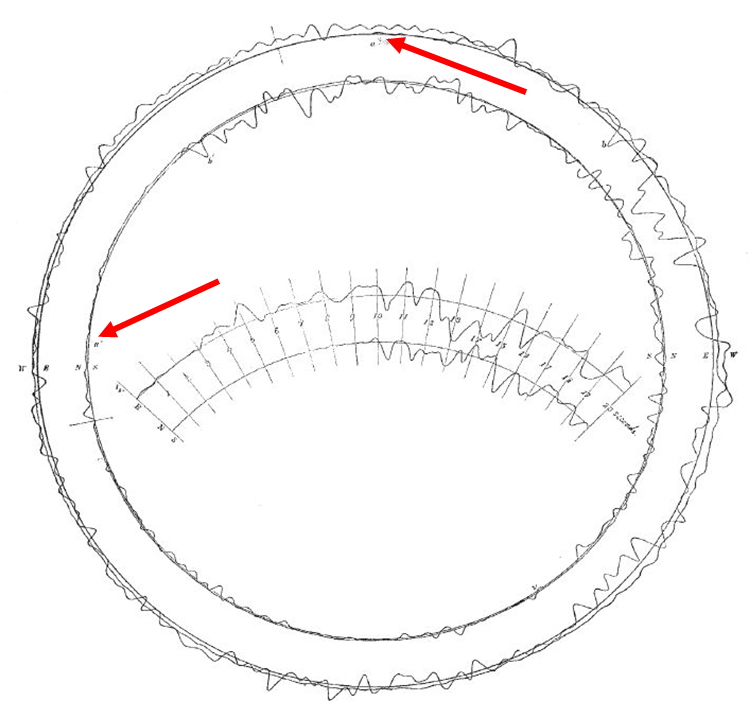
Figure 1: The oldest available seismic recording in the world was made 137 years ago today in Japan with a seismograph invented by J.A. Ewing. It shows the horizontal ground movement in two perpendicular components. The arrival of seismic waves of the quake is marked by red arrows (adapted from “Nature”, 19 June 1884, pg. 174)
Seismograms are at the heart and soul of earthquake science. Generated by sensitive instruments, they show how the ground or a building wiggles in response to seismic shaking. By analyzing and interpreting such recordings, we Earth scientists have learned what the internal structure of the earth is, how earthquake faults break and how buildings sway in response to seismic waves. Today the sensors which make seismograms — they are called seismometers or accelerometers — are ubiquitous. In fact, most readers of this blog own such a sensor, probably without realizing it. The reason: Each smartphone contains a tiny chip which records any motion the phone makes, be it because the owner carries it in the pocket while jogging or the phone is shaken by seismic waves while lying idly on a desk.
Only a few decades ago seismometers were rare and far between. Until the late 1960's, most seismic sensors were monsters weighing hundreds of pounds. At the same time, they were also delicate mechanical wonders with sensitive springs and needles, which had to be carefully adjusted. The very first of these mechanical seismographs were invented in the late 19th century, mainly in Italy, Germany and by British scientists in Japan. Some of these old instruments are preserved in museums or seismic research institutions. For instance, the Berkeley Seismological Laboratory still has one of these old seismographs made in Germany. Although it is more than 100 years old, it is still functioning, although we don't use its recordings anymore.
While old seismographs can still occasionally be found, to run across a really old seismogram is much rarer. Time has taken its toll on these old recordings on paper and many seismic traces have been lost. During the course of the last few years, the blogger has tried to find the oldest seismic recording anywhere. For instance, many very good recordings exist from seismographs all over the world of the famous San Francisco earthquake of 1906. In his very detailed report about this quake, UC Berkeley Professor of Geology Andrew Lawson reproduced many of these recordings, thereby preserving them for posterity.
However, only very few seismograms are known going further back in time. The oldest one found by the blogger was recorded 137 years ago today in Japan. A few years earlier, the Scottish physicist James Alfred Ewing had been hired by the Imperial University in Tokyo to help bring the sciences in that country into the modern age. Feeling the many earthquakes in Japan, Ewing invented a seismograph, with which he recorded the temblors in the greater Tokyo area. His instrument was sensitive to the horizontal ground motion in two perpendicular directions. It made a record by having two needles scratch two concentric traces in sync with the motion of the instrument's mass on a revolving glass disk. This disk was heavily covered with soot from smoke.
By coincidence, Ewing was present in the room where he had set up the instrument when on March 8, 1881 the ground began to shake during a local earthquake. The vibrations lasted for about 150 seconds and the recording is shown in our figure.
In order to interpret this very first seismogram, let's look at the two rings. The glass disk is revolving counterclockwise at the rate of about one revolution every 50 seconds. While it is turning, the outer ring is scratched into the soot of the smoke by a needle that moves in sync with the ground motion in the east-west direction. The inner ring represents the north-south motion. In order not to interfere with each other, the needles are offset by a quarter turn. The two red arrows show the onset of the seismic waves. It seems as if the waves arrive at different times at the two components, which is of course not the case. To limit the confusion this may cause, Ewing shifted the two traces so that they overlap. The drawing in the center of the figure shows the first 20 seconds of the recording in this aligned fashion.
While the blogger's search for the oldest know seismogram was exhaustive, it is very likely that some older recordings were missed. So here is a call for help to all readers of this blog: If you know of a seismogram older than this 137 year old example, please let the blogger know. (hra150)
BSL Blogging Team: Who we are
Recent Posts
-
: Alerts for the Whole West Coast
-
: Destruction in the Eastern Aegean Sea
-
: An Explosion in Beirut heard all over the Middle East
View Posts By Location
Categories
- Alaska (3)
- Bay Area (24)
- Buildings (3)
- Calaveras (4)
- California (13)
- California ShakeOut (3)
- Central California (4)
- Chile (4)
- Earthquake Early Warning (10)
- Earthquake Faults and Faulting (44)
- Earthquake Science (3)
- Haiti (3)
- Hayward (12)
- Indonesia (4)
- Induced Seismicity (3)
- Instrumentation (18)
- Italy (6)
- Japan (7)
- MOBB (3)
- Mendocino Triple Junction (5)
- Mexico (7)
- Nepal (3)
- North Korea (5)
- Nuclear Test (5)
- Ocean Bottom Seismometer (3)
- Oklahoma (4)
- Plate Tectonics (18)
- Preparedness, Risks, and Hazards (16)
- Salton Sea (3)
- San Andreas Fault (14)
- Seismic Waves (13)
- Seismograms (4)
- ShakeAlert (3)
- Southern California (5)
- Surface Waves (3)
- Today in Earthquake History (20)
- Volcanoes (4)
- subduction (3)