Regional.vectorial.tomography
3-D Shear Wave Radially and Azimuthally Anisotropic Velocity Model of the North American Upper Mantle
Huaiyu Yuan [1] & Barbara Romanowicz [2]
Contents |
Model Description
The Berkeley North American regional shear velocity model is an isotropic and radially and azimuthally anisotropic Vs model for the North American upper mantle. The isotropic and radial anisotropic portion of the model is developed using long period 3-component fundamental and overtone surface waveforms in the frame work of the Non-linear normal Mode Asymptotic Coupling Theory (Li and Romanowicz, 1995;1996). A joint inversion of surface waveforms and SKS station average datasets is used in the azimuthal anisotropy inversion (Montagner et al. 2000; Romanowicz and yuan 2012).
The model reveals the presence of three anisotropic layers throughout the stable part of the North American cratonic upper mantle (Yuan and Romanowicz, 2010), as illustrated in the cartoon. While in the bottom asthenospheric layer the fast axis direction is parallel to the current plate motion direction, the top two lithospheric layers have distinct fast axis directions, with ancient suture zone trending directions in the top layer and a general north-south direction in the bottom layer, respectively. The boundary between the two lithospheric layers, as defined by systematic changes in the direction of azimuthal anisotropy, correlates well with the sharp mid-lithospheric negative velocity boundary found by available S-wave receiver function measurements. This spatial correlation suggests that the two boundaries, found by the surface wave inversion and receiver functions, may share a common origin, possibly during the lithosphere formation, which indicates that accretion by shallow subduction may have played an important role in the North American craton formation (Yuan and Romanowicz, 2010; Yuan et al., 2011).
The results are highlighted in the following papers, and summarized in the BSL annual reports below:
- Yuan, H. and Romanowicz, B., Lithospheric layering in the North American Craton, Nature, 466, 1063-1068, 2010. Download PDF.
- Yuan, H. and Romanowicz, B., Depth Dependent Azimuthal anisotropy in the western US upper mantle, Earth Planet. Sci. Lett., doi:10.1016/j.epsl.2010.10.020, 2010. Download PDF.
- Yuan, H., Romanowicz, B., Fischer, K.M. and Abt, D., 3-D shear wave radially and azimuthally anisotropic velocity model of the North American upper mantle, Geophys. J. Int., 184, 1237-1260, 10.1111/j.1365-246X.2010.04901.x, 2011. Download PDF.
| |
Download the 2010 Model
Model in Matlab
The 3D model of the isotropic Vs, radial and azimuthal anisotropy variations can be accessed here, in a form of MATLAB .mat files and supporting scripts.
Some examples are provided to construct 1D profiles at a point, 2D depth-cross sections, 2D map views and 3D volumes.
To make different profiles/maps/3D volumes than in the examples, change only the lat/lon/depth variables in the beginning of the scripts.
Go to the Download Page for the 3D model.
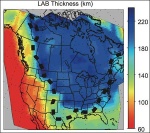
LAB and MLD maps in ascii format
The LAB and MLD maps from Yuan and Romanowicz 2010 can be accessed directly below:
Vs maps in ascii format
- File:NA.2010.vs.tar.gz from 50 km to 350 km in 25 km increment.
| |
Research Highlights
The research highlights are taken from the BSL 2010 Annual Research Report. The following points to the BSL annual report page. Individual reports can be accessed here:
Anisotropic Layering of the North American Craton
http://seismo.berkeley.edu/annual_report/ar09_10/node13.html
3-D Shear Wave Radially and Azimuthally Anisotropic Velocity Model of the North American Upper Mantle
http://seismo.berkeley.edu/annual_report/ar09_10/node14.html
Depth Dependent Azimuthal Anisotropy in the Western US Upper Mantle
http://seismo.berkeley.edu/annual_report/ar09_10/node15.html
Plot 1D model from EPSL 2014 model
From Yuan & Romanowicz, 2014 latest model of NA published.
Here you can find a matlab code which reads and plots the 1D model.
Just set the path for the 1D model file (noheaders) and run the code.
Here are code and model:
/data/dogmatix/clouzet/PHD/tarfiles/EPSL.2014.plot.tar.gz