Electronic Supplement to
Coseismic slip distributions of the 26 December 2004 Sumatra-Andaman and 28 March 2005 Nias earthquakes from GPS static offsets

by Paramesh Banerjee, Fred Pollitz, B Nagarajan, and Roland Bürgmann

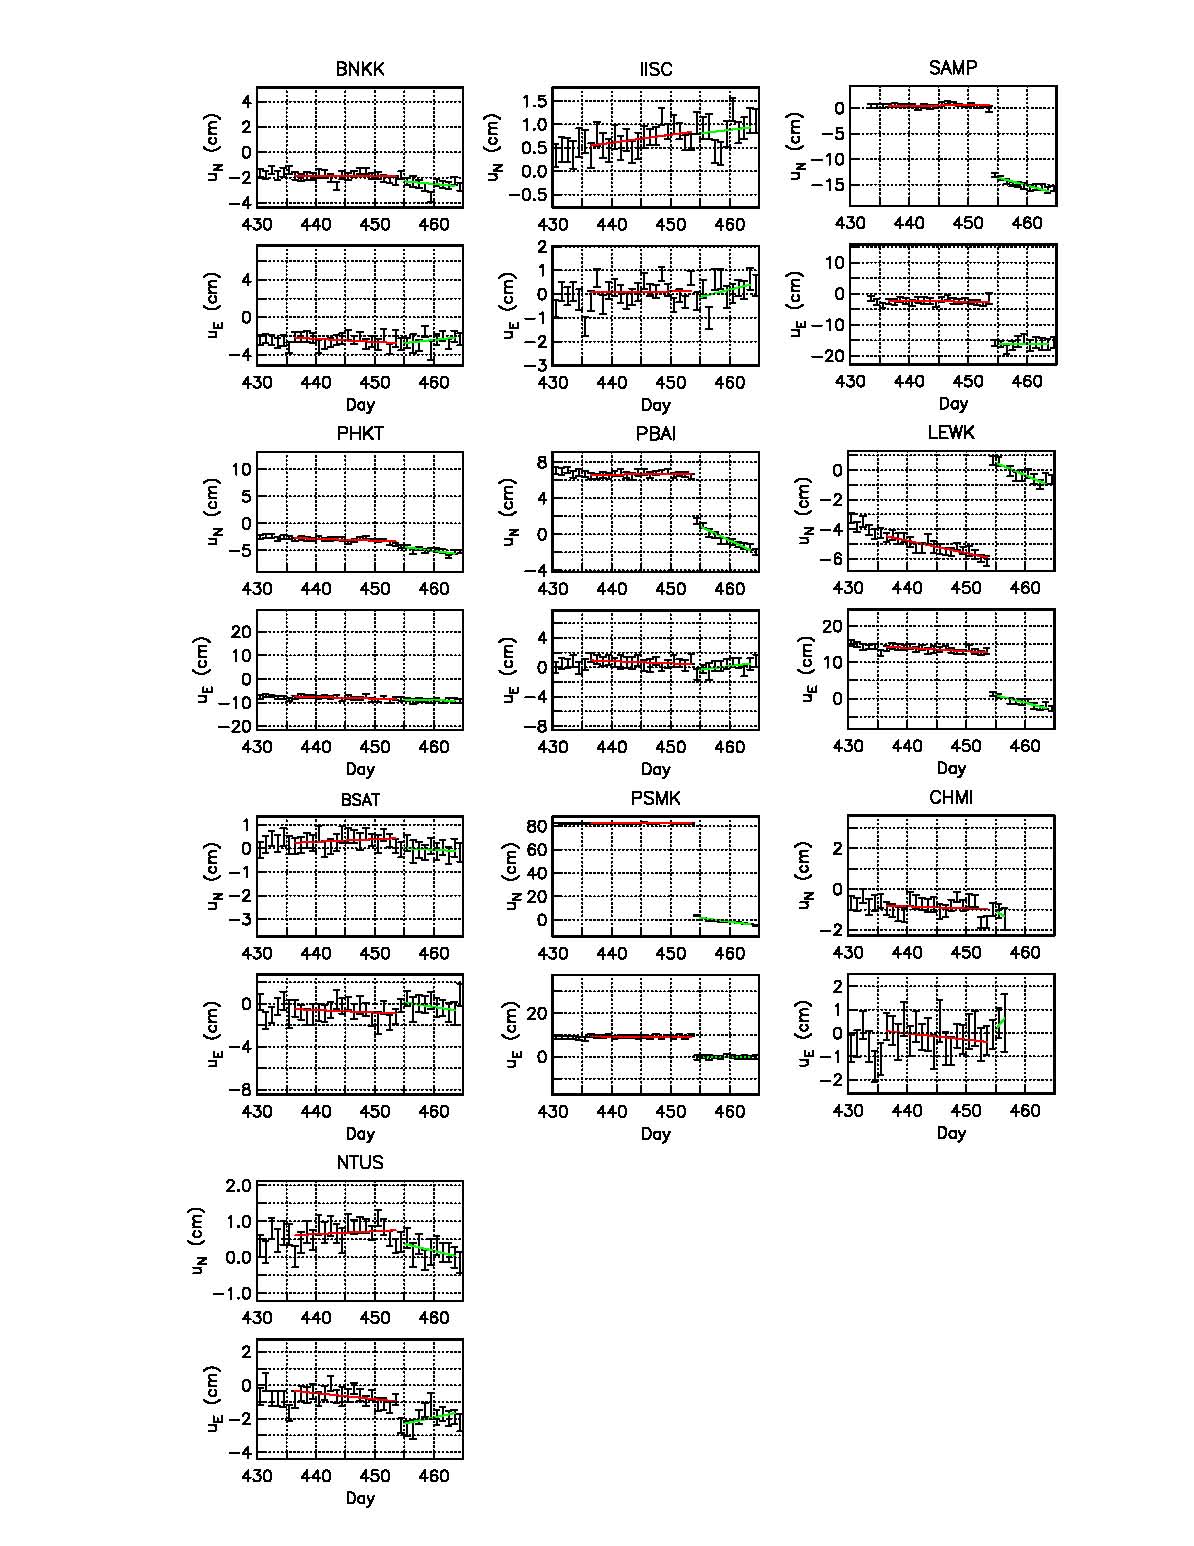
This supplement contains: (1) examples of how 1-day coseismic offsets are determined in this study for both the 2004 Sumatra-Andaman and 2005 Nias earthquakes, (2) comparisons of our newly-determined geodetic offsets with those of Banerjee et al. (2005) and Vigny et al. (2005), (3) comparisons of seismicity with coseismic dislocation planes, (4) comparisons between horizontal offsets predicted on a spherically-layered model and a homogeneous half-space, and (5) tables of coseismic offsets of continuous and campaign GPS sites for the 2004 Sumatra-Andaman and 2005 Nias earthquakes. Since topics (1), (3), and (5) are discussed at length in the main paper, we discuss here primarily topics (2) and (4).

Figure S-1 illustrates the procedure for estimating horizontal coseismic offsets using 18 days preseismic and 9 days postseismic motions of the 2004 Sumatra-Andaman earthquake. The straight-line fits to the preseismic and postseismic displacements are extrapolated to times just before and 1 day after the earthquake, and the coseismic offset is formed by the difference between these two values.

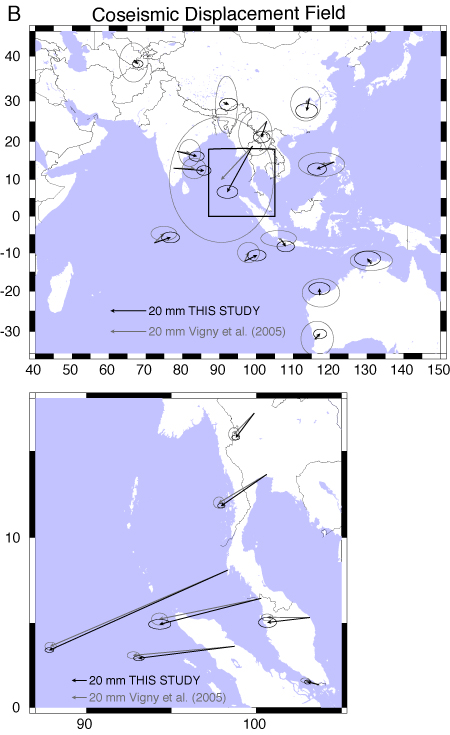
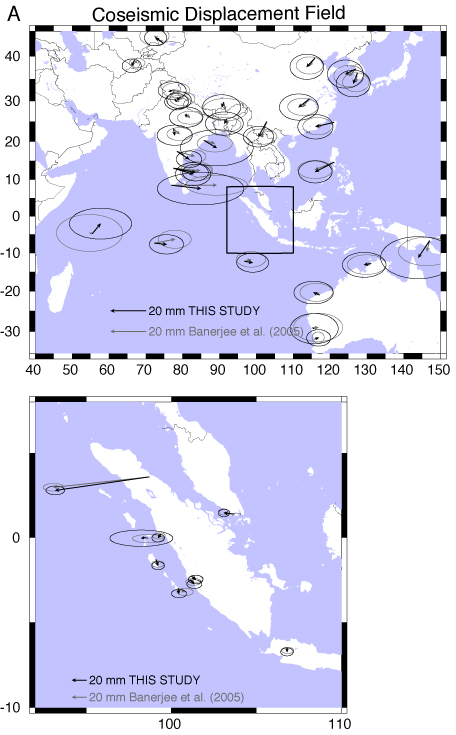
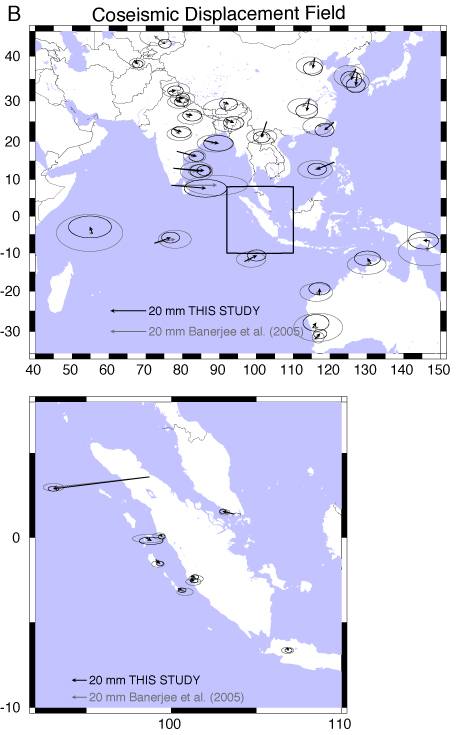
Figures S-2a and S-3a show comparisons of presently-determined CGPS horizontal offsets using t1 - t0 = 1 day with those of Vigny et al. (2005) (their Table 1) and Banerjee et al. (2005) at common sites (22 common sites with Vigny et al. (2005), 41 common sites with Banerjee (2005)). Between latitudes of about -10° and 20°N, there is a systematic shift of the Vigny et al. (2005) displacement vectors of ~ 7 mm to the northwest. A corresponding shift of about ~ 4 mm to the north exists for the Banerjee et al. (2005) displacement vectors. When a 9-day average rather than a linear fit is used to estimate the postseismic positions, then the above discrepancies are reduced. Figures S-2b and S-3b show the comparisons in this case. The systematic offsets of the CGPS sites located east of the rupture in the latitude range -10° to 20°N are reduced to about 4 mm for the Vigny et al. (2005) vectors and a negligible value (~ 1 mm) for the Banerjee et al. (2005) vectors. We note that the Banerjee et al. (2005) displacement vectors were derived using 5-day postseismic averages, and the Vigny et al. (2005) displacement vectors were derived using 14-day or 5-day averages, depending on the magnitude of the coseismic offset (C. Vigny, pers. comm., 2006). Like the 9-day average used in the comparisons of Figures S-2b and S-3b, the estimated displacement vectors in those studies thus effectively include several days of postseismic movements. The greater discrepancies exhibited in Figures S-2a and S-2b are then understood to arise from the near-absence of postseismic deformation in the presently estimated displacements using t1 - t0 = 1 day, whereas the estimates of Vigny et al. (2005) and Banerjee et al. (2005) include several mm of postseismic deformation. This conclusion is supported by the fact that the discrepancies exhibited in Figures S-2a and S-2b affect primarily sites located within 1500 km of the coseismic rupture and not very distant sites. Given the likely source of the above discrepancies, we prefer to use the new estimates of coseismic offsets derived using t1 - t0 and to adjust the coseismic offsets of additional sites from Vigny et al. 2005 using their own estimates of postseismic displacements. The complete set of 53 coseismic horizontal displacement vectors derived in this study from our analysis of CGPS measurements is given in Table S-1 and plotted in Figure 3 of the main paper.

The estimates of postseismic offsets provided by Table 2 of Vigny et al. (2005) afford a way to render their estimates of coseismic offsets more consistent with ours. We correct the coseismic offset estimates of Vigny et al. (2005) (their Table 1) by subtracting postseismic offsets determined over the 5 days after the earthquake (their Table 2). This is expected to remove most of the postseismic motions, since a 14-day postseismic average for the post-earthquake positions is roughly equivalent to including 7 days postseismic motions. When compared with our newly derived coseismic offsets at the 21 common sites (Figure S-2c) we find that the discrepancy with the original "coseismic" offsets (Figure S-2a) is substantially reduced. Given the approximate compatibility of the newly derived coseismic offsets and the corrected Vigny et al. (2005) offsets, we augment our dataset with 48 additional CGPS displacement vectors from Vigny et al. (2005), corrected with the above procedure. We also include 7 additional SGPS displacement vectors from Vigny et al. (2005) for which they have made a postseismic correction using the postseismic motions at nearby CGPS sites. The offsets thus derived from the Vigny et al. (2005) dataset are given in Table S-2.

Figure S-4 shows cross-sections of seismicity from 1915 to 2005 (Engdahl et al., 2006) compared with our chosen coseismic dislocation planes (cross-section locations and plane labels are shown in the inset).

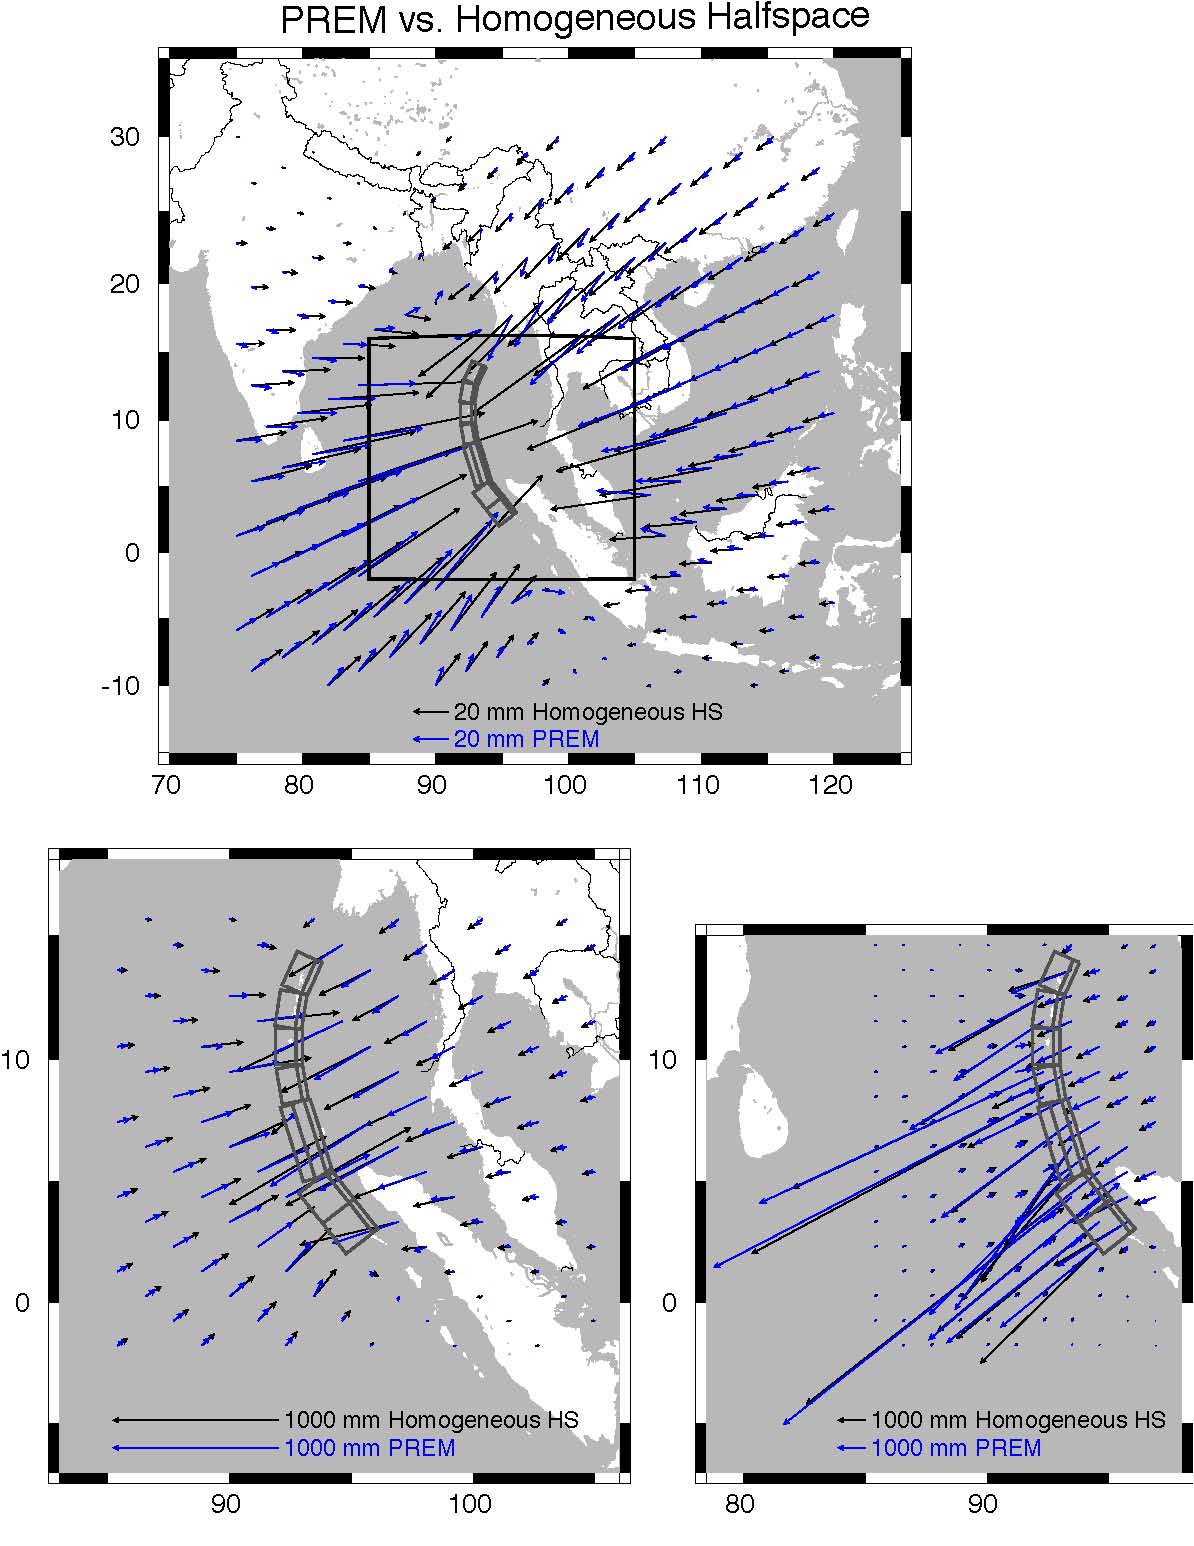
The effects of sphericity and layering in elastic structure exert a substantial influence on predicted static response to imposed dislocation sources (Banerjee et al., 2005). Figure S-5 shows a comparison between predicted horizontal displacements on the PREM model and a homogeneous halfspace (HHS) using slip Model C. Very close to the rupture where horizontal displacements are several meters, PREM displacements are slightly larger than those on the HHS. At intermediate distances of ~ 50 - 600 km, HHS displacements are much larger than PREM displacements, particularly at the upper end of this distance range. Beyond ~ 600 km distance HHS displacements are still larger than those of PREM, but the disparity is not as great as at intermediate distances. These patterns are consistent with previous global comparisons presented by Banerjee et al. (2005) and regional comparisons presented by Pollitz (1996) and Hearn and Bürgmann (2005). The great disparity at intermediate distances reflects the sensitivity of static displacement to increasingly deeper Earth structure with greater distance from the rupture. Since the shear and bulk moduli increase with depth in the PREM model, this results in increasing PREM-HHS disparity with increasing distance. At about 600 km distance, however, sphericity effects become important and reverse the above trend. This results in a reduced disparity between PREM and HHS displacements in the far field. This delicate interaction between layering and sphericity demands the inclusion of both effects if static-displacement measurements from a wide range of distances are to be properly interpreted. It further suggests that forward and inverse models based on the HHS approximation are approximately valid in the near field and far field -- but not in the intermediate field.

Figure S-6 illustrates the procedure for estimating horizontal coseismic offsets using 18 days preseismic and 7 days postseismic motions of the 2005 Nias earthquake.

References

Banerjee, P., Pollitz, F., and Bürgmann, R. (2005). Size and duration of the great 2004 Sumatra-Andaman earthquake from far-field static offsets. Science, 308:1769--1772.

Engdahl, E., Villasenor, A., DeShon, H., and Thurber, C. (2006). Teleseismic relocation and assessment of seismicity (1918-2005) in the region of the 2004 Mw 9.0 Sumatra-Andaman and 2005 Mw 8.6 Nias Island great earthquakes. Bull. Seismol. Soc. Am., submitted.

Hearn, E. and Bürgmann, R. (2005). The effect of elastic layering on inversions of GPS data for earthquake slip and stress changes. Bull. Seism. Soc. Am., 95:1637--1653.

Jade, S., Ananda, M., Kumar, P., and Banerjee, S. (2005). Co-seismic and post-seismic displacements in Andaman and Nicobar islands from GPS measurements. Current Science, 88:1980--1984.

Pollitz, F. F. (1996). Coseismic deformation from earthquake faulting on a layered spherical earth. Geophys. J. Int., 125:1--14.

Subarya, C., Chlieh, M., Prawirodirdjo, L., Avouac, J.-P., Bock, Y., Sieh, K., Meltzner, A.J., Natawidjaja, D.H., and McCaffrey, R. (2005). Plate-boundary deformation associated with the great Sumatra-Andaman earthquake. Nature, 440: 45--51.

Vigny, C., Simons, W., Abu, S., Bamphenyu, R., Satirapod, C., Choosakul, N., Subarya, C., Socquet, A., Omar, K., Abidin, H., and Ambrosius, B. (2005). GPS in SE Asia provides unforseen insights on the 2004 megathrust earthquake. Nature, 436:201--206.
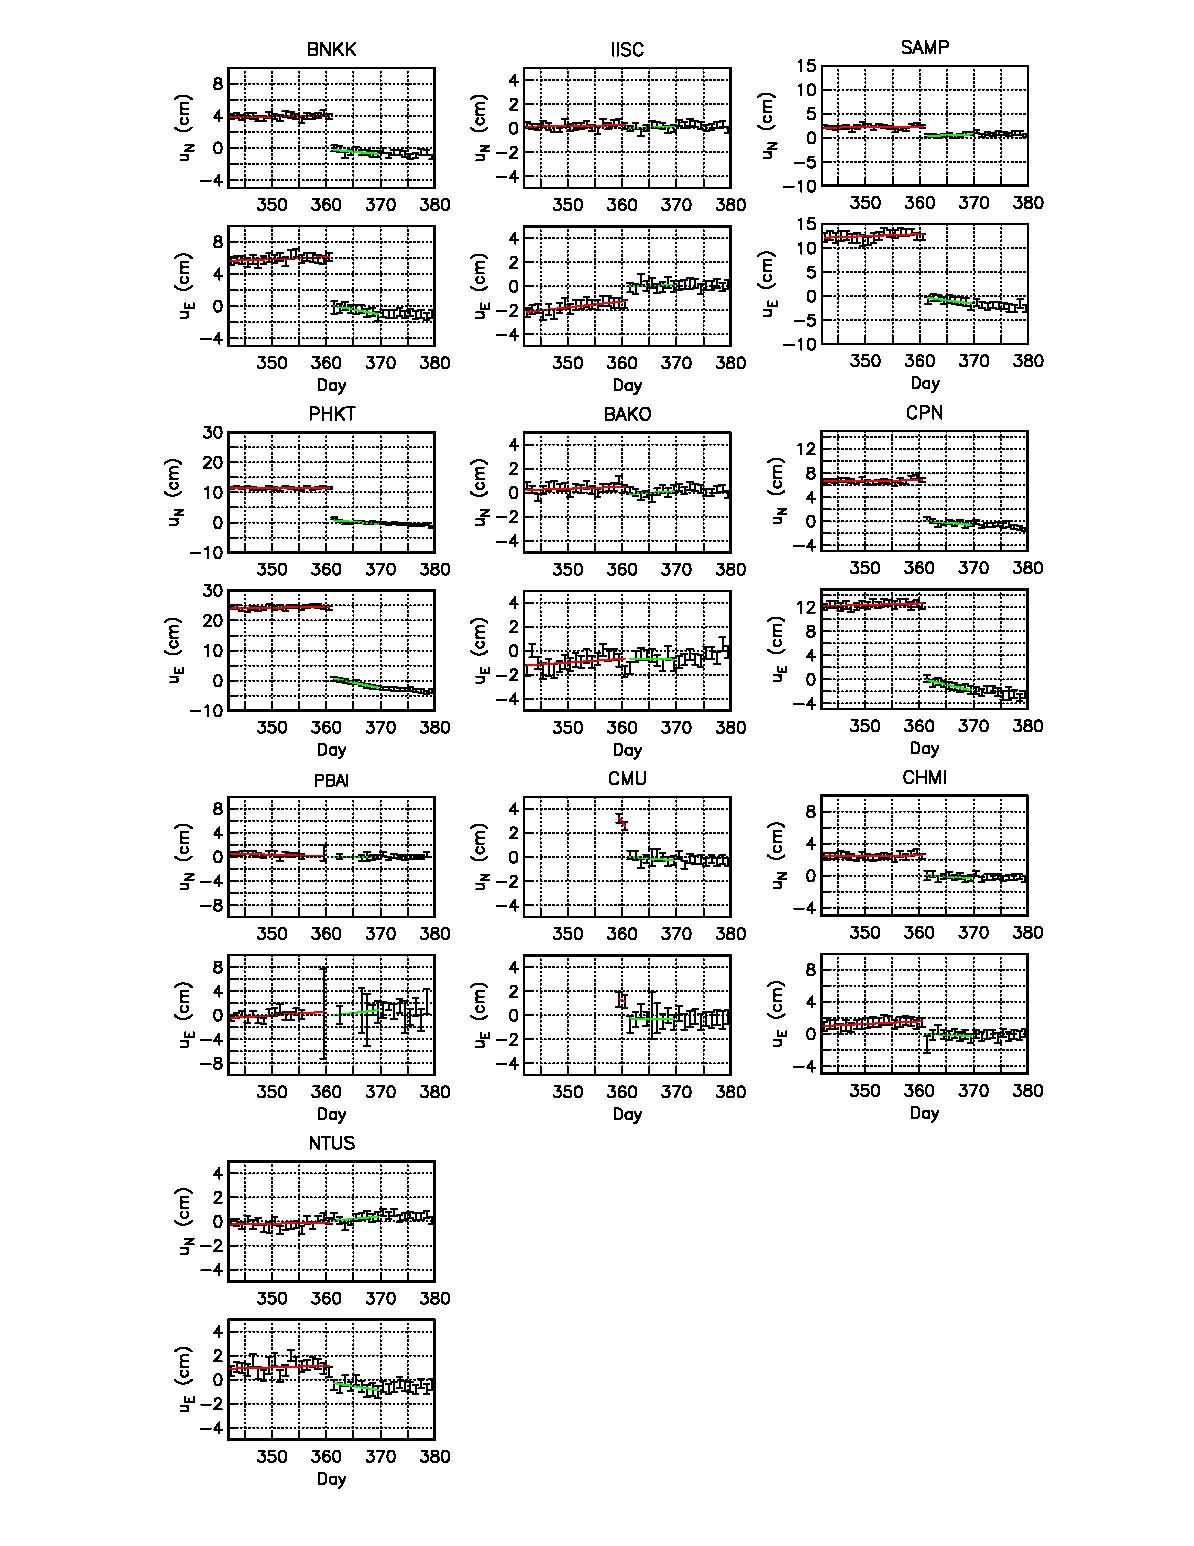
Figure S-1: Observed GPS time series following the 26 December 2004 earthquake with 1-sigma errors at selected continuous GPS sites (site locations in Figure 3 of main paper). uE and uN refer to east- and northward displacement, respectively. Day numbers refer to the year 2004. Superimposed in red and green are the straight-line fits to 18-day portions of the pre-seismic and 9-day portions of the post-seismic time series, respectively.


Figure S-2: Newly-determined coseismic horizontal displacement field, shown by black arrows, compared at common sites with the coseismic displacement field of Vigny et al. (2005), shown by gray arrows. The new displacement field is based on either (a) a straight-line fit of 18 days pre-seismic observations up to time t0 and 9 days post-seismic observations beginning at time t1, with t1 - t0 = 1 day;


Figure S-2: (continued) (b) 18-day averages of pre-seismic and 9-day averages of postseismic observations; or


Figure S-2: (continued) (c) straight-line fits as in (a), compared with coseismic offsets of Vigny et al. (2005) corrected for the first 5 days postseismic displacements (Table 2 of Vigny et al. (2005)). In cases (a) and (c), the displacement at time t0 on the pre-seismic line segment is subtracted from the displacement at time t1 on the postseismic line segment to yield the coseismic displacement.


Figure S-3: Newly-determined coseismic horizontal displacement field, shown by black arrows, compared at common sites with the coseismic displacement field of Banerjee et al. (2005), shown by gray arrows. The new displacement field is based on either (a) a straight-line fit of 9 days pre-seismic observations up to time t0 and 9 days post-seismic observations beginning at time t1, with t1 - t0 = 1 day, or


Figure S-3: (continued) (b) 18-day averages of pre-seismic and 9-day averages of postseismic observations. In case (a), the displacement at time t0 on the pre-seismic line segment is subtracted from the displacement at time t1 on the postseismic line segment to yield the coseismic displacement.


Figure S-4: Cross-sections of seismicity from 1915 to 2005, including aftershocks of the 26 December 2004 event (Engdahl et al., 2006), along seven different 100-km-wide slices. The inset shows the cross-section slices indicated with gray planes, the trench axis as determined by Engdahl et al. (2006), and the dislocation planes used in this study outlined with gray lines (Table 1 of the main paper).


Figure S-5: Comparison between horizontal offsets predicted on the PREM (layered spherical) elastic structure and those on a homogeneous halfspace with Poisson's ratio of 0.25, using slip Model C of the 26 December 2005 earthquake.


Figure S-6: Observed GPS time series following the 28 March 2005 earthquake with 1-sigma errors at selected continuous GPS sites. uE and uN refer to east- and northward displacement, respectively. Day numbers refer to the year 2004. Superimposed in red and green are the straight-line fits to the 18-day portions of the pre-seismic and 7-day portions of the post-seismic time series, respectively.


Lat Lon     Eoffset     Noffset     Esig     Nsig Site
°N °E mm mm mm mm
0.22 99.39 -4.22 -5.11 3.66 2.32 ABGS
6.45 100.28 -130.25 -33.76 9.14 4.05 ARAU
-36.60 174.83 -5.83 0.59 4.38 2.68 AUCK
-6.49 106.84 0.06 -5.84 3.67 2.27 BAKO
13.03 77.51 11.18 -3.34 4.11 2.68 BAN2
30.8 78.6 0.89 -1.45 2.86 1.97 BHTW
20.3 85.8 7.22 -4.26 8.47 4.18 BHUB
13.67 100.61 -60.93 -42.55 4.26 2.61 BNKK
39.61 115.89 -4.6 -4.99 3.94 2.92 BJFS
18.77 98.97 -15.8 -24.9 4.89 2.96 CHMI
18.8 98.9 -14.04 -25.84 6.95 3.89 CMU
-12.19 96.83 4.63 -0.77 3.72 2.22 COCO
10.7 99.4 -127.39 -67.47 4.37 2.53 CPN
36.40 127.37 -2.34 -6.02 3.96 3.1 DAEJ
-12.84 131.13 -3.85 -0.72 5.07 2.9 DARW
-7.27 72.37 6.73 -0.71 3.98 2.24 DGAR
17.42 78.55 6.8 -4.37 2.95 1.95 HYDE
13.02 77.57 12.34 -2.42 3 1.96 IISC
-20.98 117.10 -3.28 1.36 4.59 2.63 KARR
-49.35 70.26 3.66 0.76 2.8 1.88 KERG
39.13 66.89 -1.53 -3.08 2.23 1.57 KIT3
13.7 100.8 -56.40 -44.26 5.10 3.08 KMI
5.32 103.14 -56.67 -5.59 7.69 4.12 KUAL
25.03 102.80 -4.66 -8.52 3.54 2.39 KUNM
-6.67 146.99 -6.39 -9.54 8.75 4.89 LAE1
29.66 91.10 -1.09 -2.76 4.45 2.87 LHAS
-2.29 101.16 5.53 -4.05 4.27 2.46 LNGG
26.9 80.9 0.1 -1.84 3.91 2.35 LUCK
-3.00 40.19 -0.41 0.35 7.52 3.73 MALI
-2.54 101.09 6.06 -5.93 4.37 2.47 MKMK
-1.33 99.09 2.85 -8.54 3.64 2.29 MSAI
32.2 76.3 1.76 0.61 3.26 2.01 NADI
-1.80 99.27 1.58 -7.94 3.99 2.36 NGNG
1.35 103.68 -14.62 1.65 3.22 2.22 NTUS
54.84 83.24 -15.17 -1.24 8.42 6.07 NVSK
78.93 11.87 1.01 0.69 2.17 1.99 NYAL
-0.03 98.53 -6.29 -0.69 18.19 4.73 PBAI
-31.80 115.89 2.09 0.74 2.81 1.92 PERT
8.11 98.31 -239.3 -107.72 4.62 2.56 PHKT
14.64 121.08 -10.73 -5.49 3.89 2.55 PIMO
42.68 74.69 -4.32 2.93 2.59 1.89 POL2
-2.97 100.40 1.28 -7.23 4.31 2.42 PRKB
23.2 77.5 0.71 -3.58 4.1 2.34 RRLB
3.62 98.72 -132.52 -19.05 5.41 2.5 SAMP
-4.67 55.48 4.64 5.58 7.23 3.59 SEY1
25.60 91.90 -1.24 -2.45 4.43 2.68 SHL2
17.157 99.867 -30.4 -32.14 4.22 2.6 SIS2
37.28 127.05 -5.91 -3.02 4.17 3.28 SUWN
8.40 77.00 16.49 -1.86 10.07 3.76 TIR0
24.80 120.99 -10.39 -2.42 4.1 2.84 TNML
30.30 78.00 0.69 -1.11 2.74 1.9 WIH2
30.53 114.36 -6.02 -4.68 4.51 3.04 WUHN
-29.05 115.35 0.85 -0.49 5.55 3.52 YAR2

Table S-1: CGPS measured coseismic horizontal surface displacements (26 December 2004) and their 1-sigma uncertainties


Lat Lon     Eoffset     Noffset     Esig     Nsig Site
°N °E mm mm mm mm
45.96 281.93 1.16 5.33 2.46 4.67 ALGO
3.77 101.52 -55.91 2.31 2.79 1.88 BEHR
3.26 113.07 -10.39 -6.17 5.18 2.32 BINT
64.98 212.50 -3.77 -1.59 3.28 4.74 FAIR
35.43 243.11 -1.46 -3.00 3.60 4.14 GOLD
13.59 144.87 -3.89 2.37 5.52 2.88 GUAM
5.91 116.04 -5.78 -0.21 4.84 2.20 KINA
22.13 200.34 2.63 -0.71 5.24 5.05 KOKB
3.83 103.35 -39.16 1.06 3.74 2.19 KUAN
5.28 115.25 -8.18 -2.70 4.58 2.10 LABU
-54.50 158.94 -9.54 -23.19 3.69 5.09 MAC1
27.76 344.37 4.58 0.39 3.43 4.39 MAS1
19.80 204.54 1.95 0.73 4.30 3.35 MKEA
57.40 11.93 2.64 -3.81 2.58 4.53 ONSA
-0.92 119.91 -1.18 0.13 4.21 1.75 PALP
31.10 121.20 -2.9 -0.38 5.11 4.84 SHAO
-0.71 120.10 1.51 0.75 5.09 2.15 TOBP
36.11 140.09 -0.85 0.26 4.25 4.19 TSKB
-1.27 116.83 -3.65 -0.51 4.71 1.92 UNO0
5.36 100.30 -115.13 -14.41 4.78 2.90 USMP
40.44 356.05 1.16 1.44 2.33 4.53 VILL
-0.87 119.59 -1.53 -0.98 4.29 1.80 WATP
-29.05 115.35 0.86 -0.65 4.10 4.00 YAR1
62.48 245.52 -0.23 0.28 2.70 4.28 YELL
1.57 103.64 -19.51 4.55 3.69 2.15 UTMJ
-35.40 148.98 8.35 0.11 4.69 4.96 TIDB
2.83 101.54 -45.01 3.47 3.93 2.45 BANT
4.86 101.96 -70.52 -2.37 4.58 3.03 GMUS
5.44 101.13 -90.92 -10.88 3.68 2.57 GRIK
1.54 103.80 -17.92 3.81 3.93 2.35 JHJY
4.60 101.09 -77.49 -1.93 3.59 2.48 JUIP
2.21 102.26 -27.73 5.23 3.81 2.35 JUML
3.56 101.66 -52.12 1.04 3.97 2.65 KKBH
2.03 103.32 -22.92 3.58 4.13 2.46 KLUG
1.33 103.45 -17.02 3.76 4.15 2.55 KUKP
6.33 99.85 -148.87 -34.99 3.51 2.73 LGKW
2.45 103.83 -26.65 3.08 4.37 2.63 MERS
3.14 101.41 -50.37 2.32 3.99 2.61 MERU
3.49 103.39 -35.15 1.71 4.06 2.56 PEKN
4.21 100.56 -85.62 -1.84 3.96 2.55 PUPK
5.22 100.70 -102.29 -11.99 3.54 2.54 SELM
5.64 100.49 -116.43 -14.03 3.50 2.64 SGPT
1.37 104.11 -16.18 3.84 3.95 2.31 TGPG
3.45 102.42 -41.55 1.49 4.60 3.16 TLOH
2.99 101.72 -42.63 4.54 4.41 2.77 UPMS
6.46 100.51 -122.47 -23.10 4.26 3.12 UUMK
5.84 118.12 -9.50 -6.02 8.22 3.37 SAND
4.26 117.88 -5.64 1.98 9.80 3.73 TAWX
10.61 99.08 -155.07 -74.82 3.95 2.37 BANH*
13.12 101.05 -68.36 -38.35 2.65 2.03 CHON
15.67 100.12 -39.38 -44.04 4.12 2.75 NAKH
7.76 98.30 -252.50 -101.93 2.49 1.85 PHUK
12.76 101.03 -74.28 -37.10 2.36 1.81 RYNG
14.90 104.42 -32.64 -18.00 3.03 2.18 SRIS
15.38 100.01 -47.15 -39.54 2.36 1.92 UTHA

Listed estimates are only those which are non-redundant with our
independent estimates in Table S-1.
* This and next 6 entries are SGPS estimates of Vigny et al. (2005).

Table S-2: Corrected CGPS measured coseismic horizontal surface displacements (26 December 2004) and their 1-sigma uncertainties derived from Tables 1 and 2 of Vigny et al. (2005).


Lat Lon     Eoffset     Noffset     Esig     Nsig     Voffset     Vsig Site
°N °E mm mm mm mm mm mm
13.63 93.05 -3551.9 -2549.2 32.7 10.5 935.5 46.7 EAST
13.28 93.03 -3770.0 -2727.7 26.3 8 575.5 40.1 ABAY
12.22 92.77 -2140.0 -1507.3 45.1 15.8 -349.4 103.4 UGRH
12.04 92.98 -1307.8 -619.6 46.5 16.8 50.8 152.6 GOVI
11.65 92.72 -2856.8 -879.2 8.6 4.4 -869.6 18.2 PORT
11.18 92.68 -2703.9 -1031.3 21.4 10.1 -734.6 42.3 PASG
10.70 92.57 -3083.0 -2564.8 13.9 6.2 170.5 56.2 RAMK
9.22 92.80 -5594.3 -2844.4 6.0 3.0 -1111.0 12.0 CARN*
8.30 93.12 -5647.0 -3145.8 18.5 8.2 -2769.6 38.6 TERE
8.04 93.55 -3975.3 -1720.5 28.0 7.9 -1260.0 40.7 KARD
7.51 93.54 -4909.4 -2849.8 24.1 8.5 -2129.1 43.7 MERO
7.00 93.93 -3970.8 -2318.9 11.1 6.6 -1439.8 19.4 CAMP

* From Table 1 of Jade et al. (2005)
The original horizontal measurements have been corrected for postseismic
movements using an afterslip model.

Epost       Npost       Site
mm mm  
-40 43 EAST
-178 7 ABAY
-282 -210 UGRH
-94 -420 GOVI
-260 -186 PORT
-260 -220 PASG
-265 -129 RAMK
-220 -140 CARN
-297 113 TERE
10 0 KARD
22 0 MERO
-220 -140 CAMP

The postseismic motions which were subtracted from the original measurements
are given by Epost and Npost. Vertical offsets are uncorrected.

Table S-3: SGPS (Survey of India) measured coseismic surface displacements (26 December 2004) and their 1-sigma uncertainties.


Lat Lon     Eoffset     Noffset     Esig     Nsig     Voffset     Vsig Site
°N °E mm mm mm mm mm mm
2.64 98.94 -78.5 -22.4 66.6 23.8 -80.5 73.3 BM12
1.69 97.45 -30.3 -26.1 64.9 25.3 -53.5 55.8 D962
2.17 96.62 11.8 -21.3 66.9 64.9 -571.4 66.9 D972
3.15 98.51 -188.0 -24.8 9.34 88.2 5.3 89.9 JAHE
2.52 98.68 -135.1 -15.0 41.4 24 -122.8 86.9 MART
2.73 98.75 -120.0 -9.2 32.6 23 -454.6 91.6 NIND
1.68 98.82 -35.9 -36.7 41.8 39.7 -26.4 27.7 PAND
2.45 99.15 -73.3 -16.7 27.7 31.1 -12.9 61.7 PISU
2.10 99.09 -95.4 -60.6 66.2 63.1 -114.4 69.9 SIPA
2.92 98.56 -129.7 -6.9 22.8 23.6 45.2 30.5 TIGA
2.53 98.64 -84.3 -4.9 27.5 22.9     TELE
5.43 95.24 -1851.4 -1741.9 105.7 88.2 -171.7 59.7 K504
5.48 95.27 -1801.4 -1722.3 103.4 87.3 -61.1 80.7 K505
5.57 95.49 -1427.9 -1317.8 83.0 67.1 -46.2 63.7 K515
4.43 98.00 -333.0 -101.5 41.1 42.6 -11.9 60.8 LANG
5.09 97.16 -512.6 -217.9 43.4 47.8 76.5 105.4 LHOK
5.33 95.93 -1254.2 -944.0 40.5 38.8 35.4 49.0 PIDI
2.96 95.39 -3816.5 -4309.4 19.1 216.1 2098.8 45.8 R171
4.61 95.52 -2744.0 -2352.5 142.7 118.8 -601.0 42.0 R173
4.84 95.37 -2628.8 -2389.4 138.6 120 -583.8 84.1 R174
5.24 95.20 -2207.9 -2057.8 121.7 103.8 -226.6 121.1 R175
5.71 95.06 -1804.9 -1664.4 108.7 85.5 -142.1 90.8 R176
5.86 95.33 -1283.3 -1248.2 79.4 64.5     R178

Horizontal displacements from Table S1 of Subarya et al. (2005) are corrected for
postseismic offsets using an afterslip model.
Vertical offsets from Subarya et al. (2005) are uncorrected.
Epost     Npost     Site
mm mm  
-11 3 BM12
-3 -1 D962
-2 -3 D972
-15 3 JAHE
-10 2 MART
-11 3 NIND
-5 1 PAND
-9 2 PISU
-7 2 SIPA

Table S-4: Corrected SGPS coseismic surface displacements (26 December 2004) and their 1-sigma uncertainties derived from Table S1 of Subarya et al. (2005)


Epost     Npost     Site
mm mm  
-13 3 TIGA
-10 2 TELE
-263 -21 K504
-266 -23 K505
-232 -24 K515
-35 3 LANG
-65 -1 LHOK
-145 -12 PIDI
-4 -13 R171
-110 -24 R173
-143 -25 R174
-227 -18 R175
-370 -47 R176
-305 44 R178
The postseismic motions which were subtracted from the original
measurements are given by Epost and Npost.

Table S-4: (continued) Corrected SGPS coseismic surface displacements (26 December 2004) and their 1-sigma uncertainties derived from Table S1 of Subarya et al. (2005)


Lat Lon     Eoffset     Noffset     Esig     Nsig Site
°N °E mm mm mm mm
0.22 99.39 -49.15 -8.42 4.28 2.15 ABGS
6.45 100.28 -18.49 -33.21 10.48 4.01 ARAU
-36.60 174.83 -4.09 -1.08 3.98 2.48 AUCK
-6.49 106.84 -0.49 0.73 2.91 1.77 BAKO
13.03 77.51 -2.08 -0.04 5.07 2.38 BAN2
30.8 78.6 0.06 1.53 3.44 1.83 BHTW
13.67 100.61 -0.03 -3.93 4.38 2.18 BNKK
39.61 115.89 2.44 -0.78 3.09 2.32 BJFS
-3.08 100.28 10.26 -4.2 5.14 2.33 BSAT
2.41 96.33 -1836.5 -1580.5 4.51 1.97 BSIM
18.77 98.97 5.35 -0.79 5.37 2.57 CHMI
18.8 98.9 3.73 -0.2 6.59 2.72 CMU
-12.19 96.83 -1.61 0.51 4.76 2.28 COCO
10.7 99.4 -2.41 -6.94 4.35 2.13 CPN
36.40 127.37 1.35 -0.84 3.22 2.54 DAEJ
-12.84 131.13 -0.39 -2.83 4.29 2.31 DARW
-7.27 72.37 8.7 -0.69 3.29 1.81 DGAR
17.42 78.55 5.45 -0.08 3.18 1.94 HYDE
13.02 77.57 -2.5 -0.41 2.55 1.58 IISC
-20.98 117.10 1.18 -0.77 4.27 2.24 KARR
-49.35 70.26 0.26 -1.15 2.65 1.86 KERG
39.13 66.89 0.46 1.16 1.89 1.32 KIT3
25.03 102.80 6.35 -0.16 3.19 1.92 KUNM
-6.67 146.99 3.52 0.25 4.71 2.49 LAE1
2.92 95.80 -117.73 64.57 4.76 2.31 LEWK
29.66 91.10 3.15 0.76 2.31 1.66 LHAS
1.38 97.13 -3171.3 -3471.7 5.70 2.00 LHWA
-2.29 101.16 7.33 -1.73 5.29 2.6 LNNG
-3.00 40.19 -6.68 -4.16 7.09 3.43 MALI
-2.54 101.09 8.96 -3.36 4.65 2.25 MKMK
-1.33 99.09 20.16 -6.81 4.72 2.22 MSAI
32.2 76.3 2.4 0.99 3.57 1.82 NADI
19.21 42.04 -2.67 -3.96 3.23 1.88 NAMA
-1.80 99.27 7.47 -5.61 4.86 2.25 NGNG
1.35 103.68 -13.11 -3.83 2.99 1.85 NTUS
78.93 11.87 -0.05 -0.17 2.1 1.9 NYAL
-0.03 98.53 -7.36 -58.45 4.79 2.22 PBAI
-31.80 115.89 0.12 -0.21 2.3 1.53 PERT
8.11 98.31 -2.23 -10.47 5.25 2.28 PHKT
42.68 74.69 1.35 -0.15 2.48 1.7 POL2
-0.09 97.86 -93.59 -817.34 3.97 1.80 PSMK
3.62 98.72 -135.70 -141.46 7.45 2.63 SAMP
24.91 46.40 -4.12 -0.22 4.3 2.33 SOLA
37.28 127.05 0.95 -2.65 3.15 2.45 SUWN
24.80 120.99 3.25 -0.28 3.7 2.38 TNML
30.30 78.00 3.95 0.29 3.25 1.86 WIH2
30.53 114.36 1.52 -2.08 4.14 2.70 WUHN
-29.05 115.35 0.73 1.13 5.24 3.24 YAR2

Table S-5: CGPS measured coseismic horizontal surface displacements (28 March 2005) and their 1-sigma uncertainties


This document was translated from LATEX by HEVEA.