There are many theories that try to explain the apparent weakness of large faults in nature, and these mechanisms fall into two main categories: permanent weakening and dynamic weakening. Permanent weaknesses are either permanent lithologic or structural properties that permit a fault to slip at low apparent coefficients of friction. Dynamic weakening mechanisms occur only during the fault rupture process and may be related either to thermal pressurization of pore fluids or a variety of mechanisms that promote decreased normal stress during rupture. At the 2001 AGU Fall Meeting, Jim Brune (U. Nevada, Reno) proposed an interesting test to distinguish between permanent and dynamic weakness using observations of surface heat flow. The basis for the test is that the creeping section of the San Andreas fault does not produce large earthquakes and therefore cannot be weakened dynamically. To distinguish between permanent and dynamic weakening, one must simply assess whether or not the creeping section is weak. Unfortunately, existing models of heat flow cannot be used to assess the expected amount of surface heat flow from a strong creeping fault because those models universally assume a semi-infinite fault. Since the creeping section is not infinitely long, we must use a more sophisticated 3-D finite element model to calculate the expected surface heat flow. Our goal is to use theoretical models of frictional heat generation and conduction to quantify the feasibility of Brune's test.
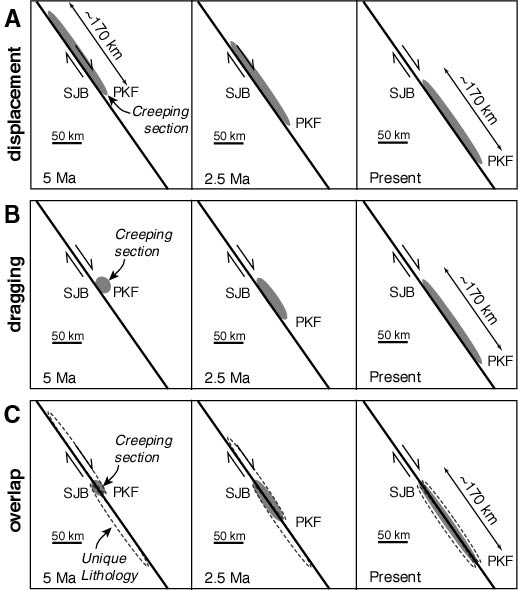
Because the two blocks of crust are moving relative to one-another, the position and/or size of the creeping section can change over time. Below are three possible geometries -- each related to a different mechanism that causes fault creep. We show the location of the towns of San Juan Bautista on the west side of the fault (SJB) and Parkfield on the east side of the fault (PKF) to illustrate the amount of offset over time. In (A), the creeping section is always the same length but is attached to the northeast side of the fault, so it is displaced as the fault accumulates offset ("displacement" model). In (B), the creeping section starts off as a small body of unique lithology that creeps. As the fault accumulates offset, the body is dragged along leaving some of the creeping material smeared along the fault zone ("dragging" model). In (C), the fault creeps because of the overlap of two materials that creep when in contact with one another but promote earthquake generation when in contact with all other rocks ("overlap" model). The expected size and position of the creeping segment is identical for dragging and overlap. Both predict that the creeping section has been getting longer with time, though the overlap theory predicts that the creeping section will start to shrink as the two bodies pass one another and are no longer in contact. It should also be noted that each model could be flipped such that the creeping section evolves to the north, rather than to the south as shown here. We prefer the model where creep begins in the north because the Franciscan melange and all its heterogeneity is prevalent on the northeast side of the fault.
Preliminary Results (below)
Below are results from 2-dimensional model runs of the expected temperature increase from a heat source at the end of 5 million years of fault offset. In our example, the creeping segment at this final state is 170 km long and with a total fault offset of 165 km. The red line shows the extent of the creeping (heat generating) fault section at the end of the model run. These models give a qualitative estimate of the geometry of the expected heat anomaly, though they cannot constrain the magnitude of change to heat flow. Further, our two dimensional models cannot address Brune's concern that the fault has not yet reached steady-state. We are currently running fully 3-D models of various heating cases to answer this question. Also note that the color scale is extremely saturated in this example such that the details of the temperature within the grey area are not shown! To see the evolution of the temperature increase over time, check out the Quicktime movies at the right.
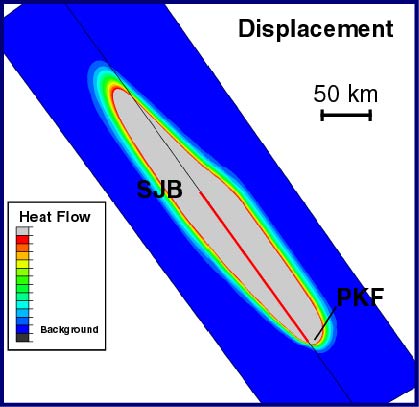
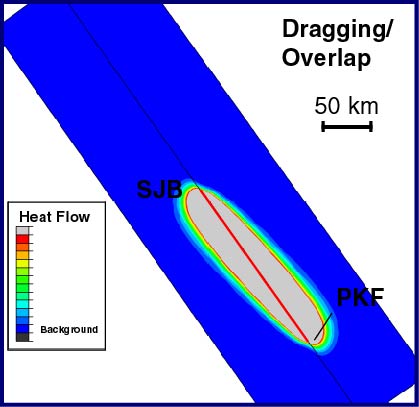
Both models show a pronounced asymmetry between the northeast and southwest sides of the fault. Such asymmetry could not be resolved with the currently available heat flow measurements because there are very few measurements between San Juan Bautista and Parkfield, and there are virtually no heat flow measurements on the northeast side of the fault in the creeping section north of Parkfield.
Download Quicktime Movie of Displacement Model (2.5 MB)
Download Quicktime Movie of Dragging/Overlap Model (2.1 MB)