Temporal Correlations
Temporal distrobution suggests a seismic response of the Sierran block to inflation within the Caldera.
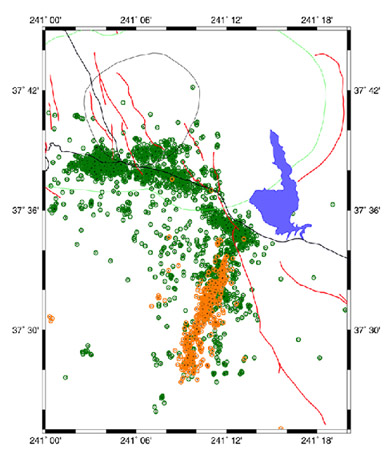
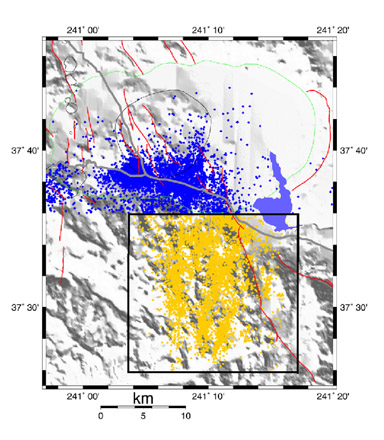 This map indicates
which seismic events are included as Hilton Block seismic events and which
are included as Caldera events in the cumulative seismicity plot. This map indicates
which seismic events are included as Hilton Block seismic events and which
are included as Caldera events in the cumulative seismicity plot. |
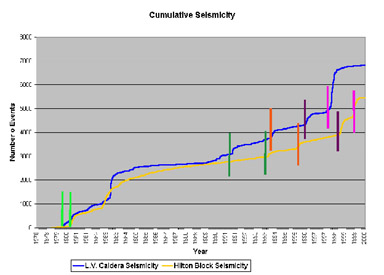
This plots show the relative temporal distribution of seismic events
between the caldera and the Hilton Block. Multi-colored vertical lines
indicate inferred seismic correlations.
 |
Progression of rupture response in the Hilton Block to Long Valley Caldera inflation can be well observed by animations of seismic events.
 |
An animation of seismic events from 1978-1999 was rendered using the NCSN earthquake catalog locations and frame intervals of one month. The animations help visualize temporal relationships and the propagation models evaluated for 1997-1999. View the animations here. |