We use Interferometric Synthetic Aperture Radar (InSAR) to monitor interseismic
deformation along the Hayward Fault. InSAR measures the change in
baseline between the satellite and a point on the ground over a given time
window. Our long term objective is to address the seismic hazard
associated with the fault by modeling the strain profile as a function
of distance away from the fault trace.
|
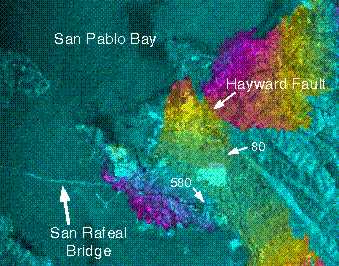
The figure on the left is a differential interferogram of the northern
Hayward Fault spanning from June of 1992 to August of 1997. The change
in color from yellow to red across the fault trace represents ~2 mm/yr
change in range which corresponds to ~6 mm/yr of right lateral fault creep. |
We have processed over 50 interferograms similar to the one shown above.
We are currently developing techniques to extract a time series from this
data set. This method has the advantage of extracting a temporal
signal while filtering out unwanted artifacts, such as atmospheric disturbances
which increase the travel time of the electromagnetic wave. A preliminary
result can be viewed as an mpeg file ( movie_nnlsq.mpg
474 Kb). The units of the color bar are in millimeters and the date
of each step is shown at the top of each frame in the format (YYMMDD).
The field of view in the movie covers the southern Hayward Fault, from
Castro Valley to Fremont. The trace of the fault crosses almost diagonally
from the upper left corner to the lower right corner, with the Livermore
Valley in the upper right corner and the southern tip of the bay in the
lower left corner. Right lateral movement is strongly observed across
Castro Valley. In Fremont the fault creep is masked by vertical movements
originating from subsurface water exiting from Niles Canyon.
The most significant error source in our interferograms originates from
changes in the index of refraction through the atmosphere which causes
a delay in the time of propagation of the electromagnetic signal.
Often the source of this delay is in the troposphere. Occasionally
the atmospheric disturbance is much closer to the ground.
|
|
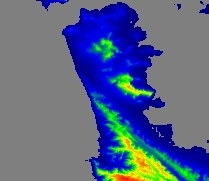
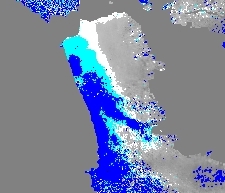
The above figures focus on the San Francisco Peninsula, with the Pacific
Ocean on the left (west) and the San Francisco bay on the right (east).
The left figure displays the topography of the peninsula and the right
figure displays contours of phase with blue to grey representing high to
low phase. A region of high phase hugs the western flank of the peninsula
and a tongue of high phase extends down a valley along the central portion
of the peninsula. This region of high phase can best be explained
by advective fog which is contained by the topographic relief. The
water vapor in the fog bank acts to delay the radar pulse resulting in
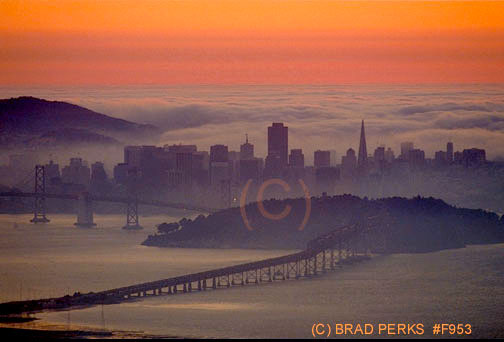
an increased phase delay. The picture below, taken from a perspective
looking west onto downtown San Francisco, illustrates how this scenario
might have looked when the data were collected.