
|
|
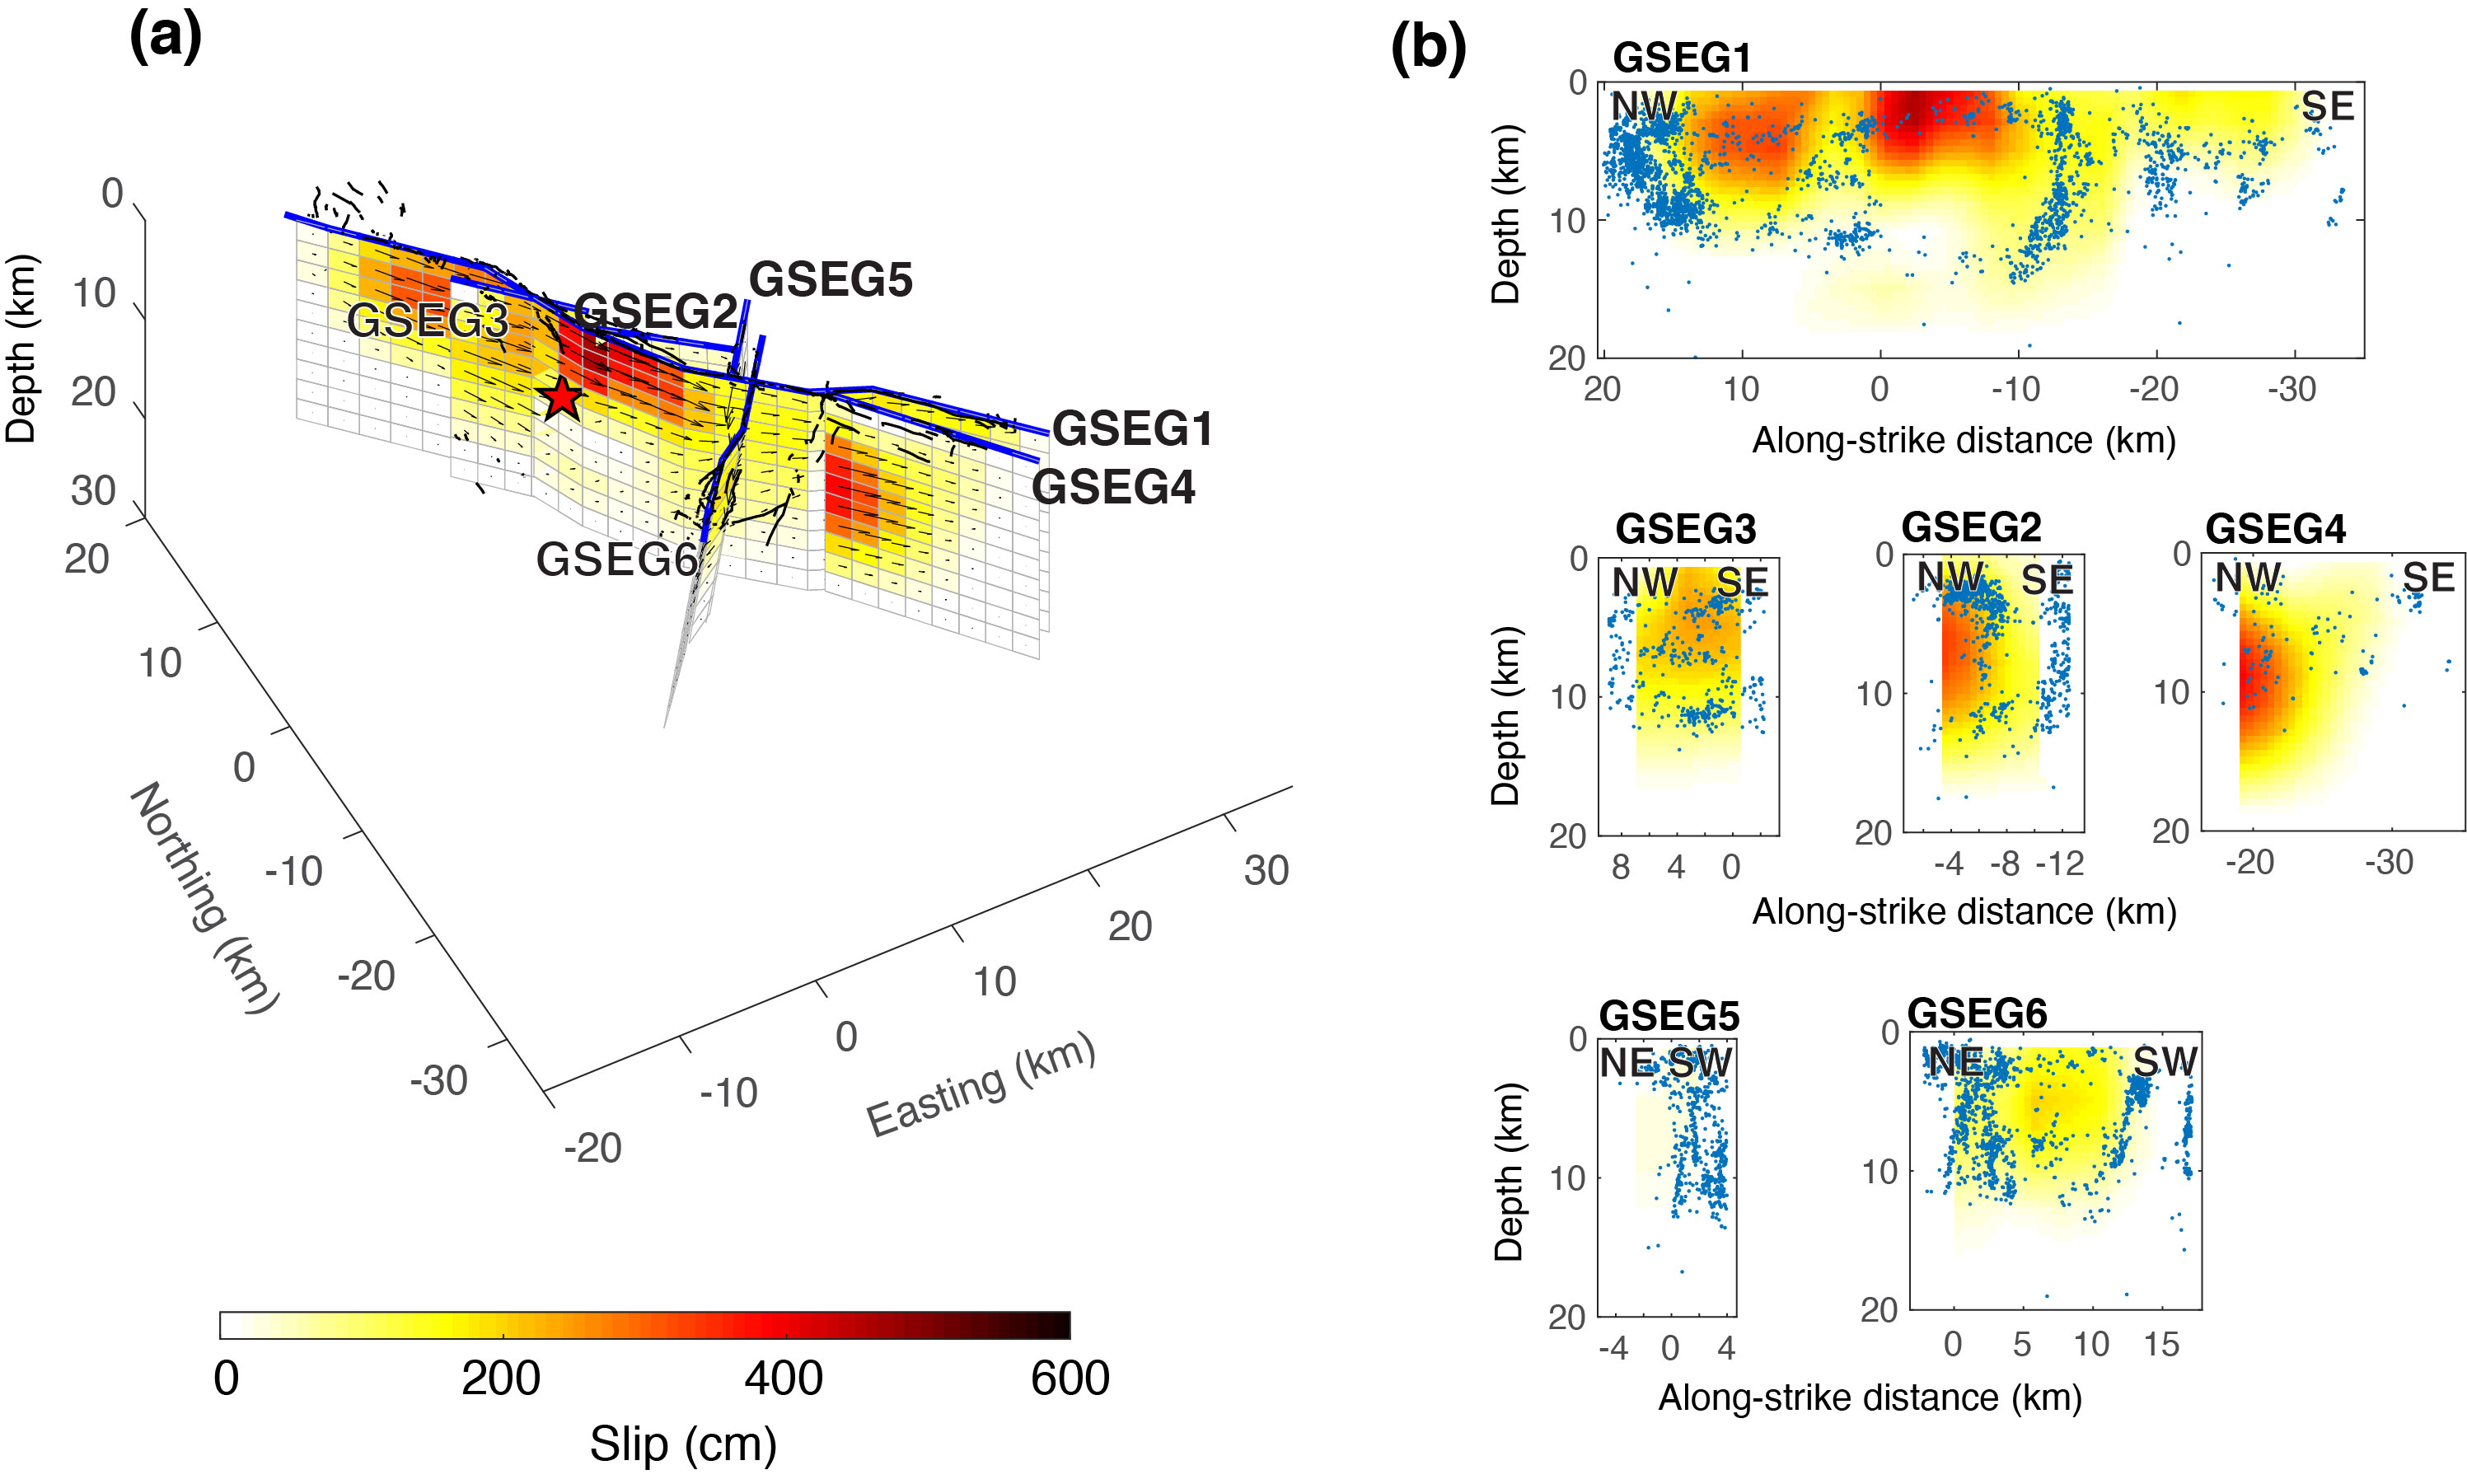
Coseismic slip model of the 2019 Ridgecrest earthquake sequence inverted from static GNSS and Sentinel-1 InSAR data. (a) Slip distribution in a 3D perspective. Black lines represent the surface traces of the 2019 Ridgecrest rupture verified by the USGS field survey. Solid blue lines represent the top edges of the slip model. (b) Slip distribution along average strike of the different fault segments. Dots are relocated aftershocks within 1 km from model surface trace during ∼5 days after the Mw 6.4 foreshock on 4 July 2019.
| Project Summary | The 2019 Ridgecrest earthquake sequence culminated in the largest seismic event in California since the 1999 Mw 7.1 Hector Mine earthquake. Here, we combine geodetic and seismic data to study the rupture process of both the 4 July Mw 6.4 foreshock and the 6 July Mw 7.1 mainshock. The results show that the Mw 6.4 foreshock rupture started on a northwest-striking right-lateral fault, and then continued on a southwest-striking fault with mainly left-lateral slip. Although most moment release during the Mw 6.4 fore- shock was along the southwest-striking fault, slip on the northwest-striking fault seems to have played a more important role in triggering the Mw 7.1 mainshock that happened ∼34 hr later. Rupture of the Mw 7.1 mainshock was characterized by dominantly right-lateral slip on a series of overall northwest-striking fault strands, including the one that had already been activated during the nucleation of the Mw 6.4 foreshock. The maximum slip of the 2019 Ridgecrest earthquake was ∼ 5 m, located at a depth range of 3-8 km near the Mw 7.1 epicenter, corresponding to a shallow slip deficit of ∼20%-30%. Both the fore- shock and mainshock had a relatively low-rupture velocity of ∼2 km/s, which is possibly related to the geometric complexity and immaturity of the eastern California shear zone faults. The 2019 Ridgecrest earthquake produced significant stress perturbations on nearby fault networks, especially along the Garlock fault segment immediately southwest of the 2019 Ridgecrest rupture, in which the coulomb stress increase was up to ∼0.5 MPa. Despite the good coverage of both geodetic and seismic observations, published coseismic slip models of the 2019 Ridgecrest earthquake sequence show large variations, which highlight the uncertainty of routinely performed earthquake rupture inversions and their interpretation for underlying rupture processes. | ||
| Tools | GPS and InSAR | ||
| Geographic Location | East California Shear Zone, California | ||
| Group Members Involved | Kang Wang <Email> <Personal Web Site> Roland Bürgmann | ||
| Project Duration | 2019 - 2020 | ||
| More Information | Coseismic Slip Model < Coseismic Slip Model >
Coseismic Surface Deformation
|
||
| Publications | BSSA article < Wang et al., BASS, 2020 > SRL article < Wang and Burgmann, SRL, 2020 > | ||