
|
|
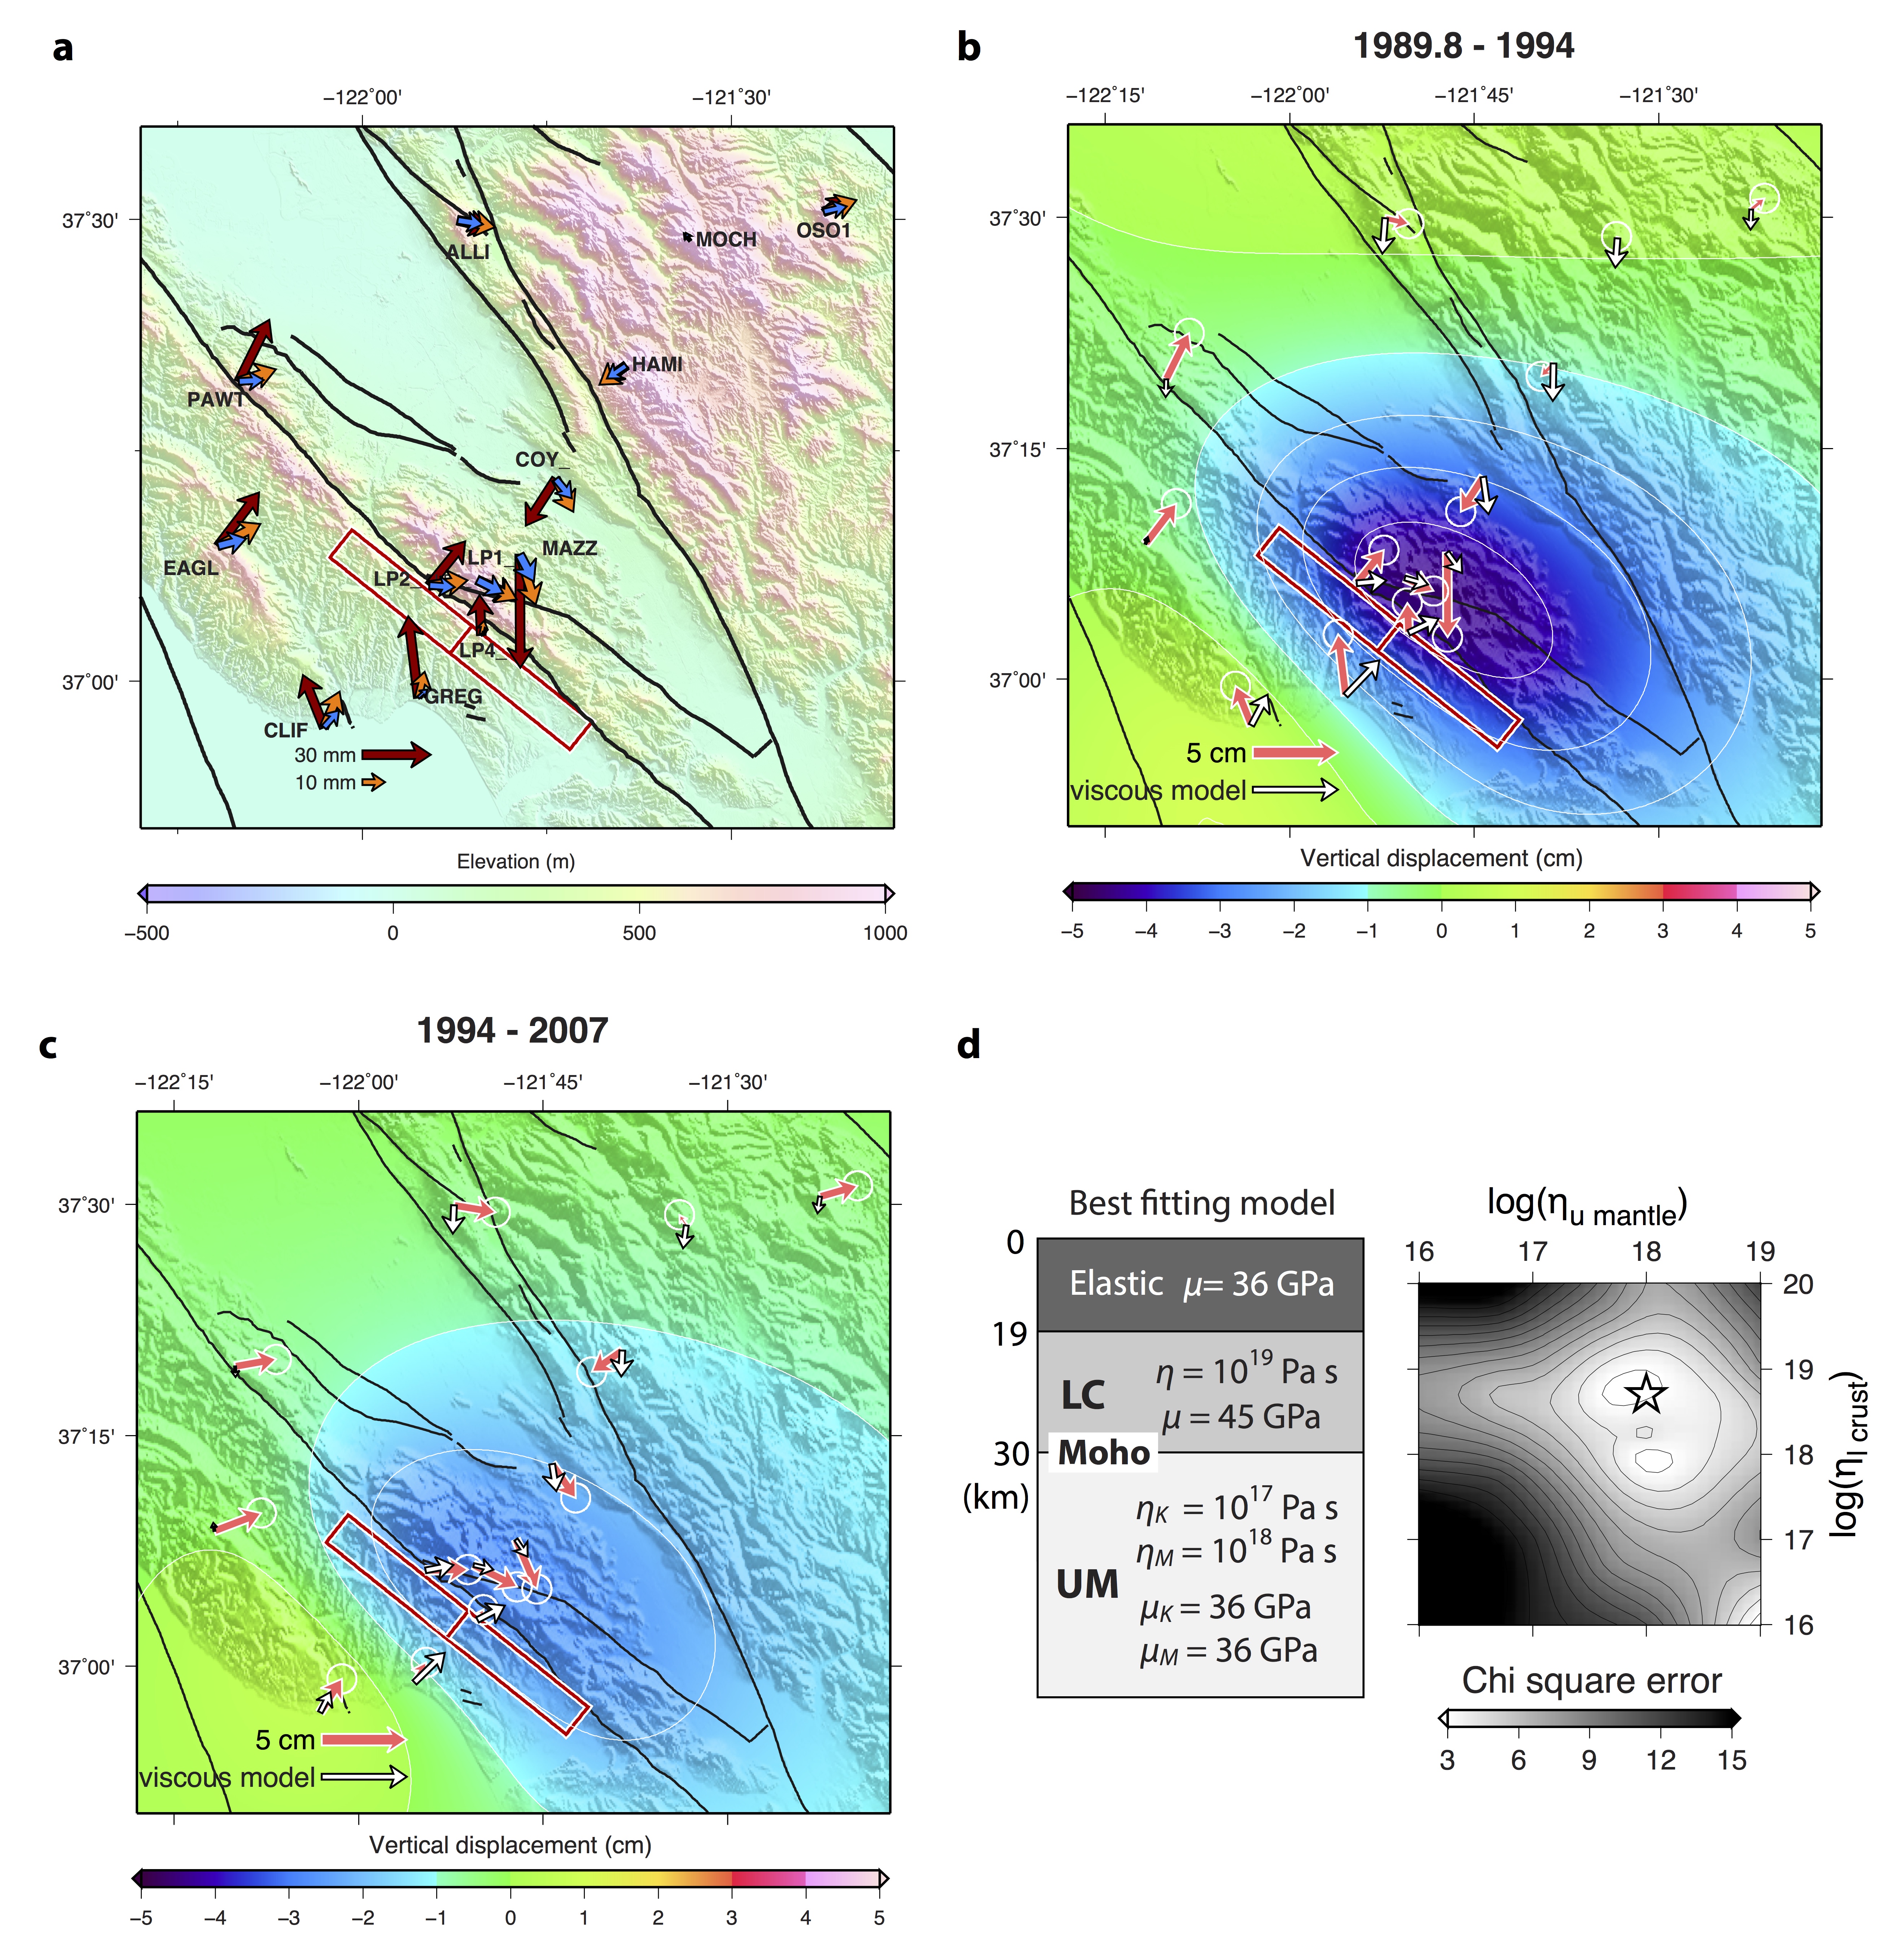
Figure 1.
(a) The Loma Prieta postseismic displacement in different periods. The arrows show the postseismc deformation in different periods (red: 1989.8 – 1994; orange: 1994 – 1999; blue: 1999 – 2004), and all of the measurements are relative to the average displacement of stations HAMI, MOCH, and OSO1. The red rectangles are the coseismic fault planes (Pollitz et al., 1998), and the black lines are the fault lines in the Bay Area. Note the change of amplitude and direction of the postseismic displacement in different periods. (b) Predicted viscoelastic relaxation in the first 4 years (1989.8 – 1994). The pink arrows are GPS displacement estimated based on the time series downloaded from the USGS website (http://earthquake.usgs.gov/monitoring/gps) and Segall et al. (2000), and the white arrows are the viscoelastic model predictions. The background color represents the vertical displacement due to the viscoelastic relaxation. (c) Predicted viscoelastic relaxation between 1994 and 2007. Note the viscoelastic fitting to the later period is better than the early period, hence implies the early period may be dominated by afterslip, which agrees with Segall et al. (2000). (d) Left: The model fitting and the rheologic structure based on the best-fitting viscoelastic relxation model. Right: The chi-square error distribution with different combinations of lower crust and upper mantle viscosities.
| Project Summary |
The 1989 Mw 6.9 Loma Prieta earthquake provides the first opportunity of probing the crustal and upper mantle rheology in the San Francisco Bay Area since the 1906 Mw 7.9 San Francisco earthquake. Here we use geodetic observations including GPS and InSAR to characterize the 1989 Mw 6.9 Loma Prieta earthquake postseismic displacement from 1989.8 to 2013. Pre-earthquake deformation rates are constrained by nearly 20 years of USGS trilateration measurements and removed from the postseismic measurements prior to the analysis. We observe 1-4 mm/yr GPS horizontal displacement toward the Loma Prieta epicenter, and ~2 mm/yr land subsidence in Almaden between 1992 and 2002 followed by ~1 mm/yr uplift until 2013. Insights into lithospheric rheology can be gained from observations of postseismic deformation, which represents the response of the Earth’s interior to coseismic stress changes. We model the viscoelastic relaxation by assuming a viscoelastic 11-km-thick lower crust below a 19-km-thick elastic upper crust, underlain by a viscoelastic upper mantle. The best fitting model is composed of an elastic upper crust, a viscous lower crust (η = 1019 Pa s), and a bi-viscous upper mantle (ηM = 1018 Pa s; ηK = 1017 Pa s), which is consistent with rheologic studies in southern California and models of the post-1906 relaxation. Repeating earthquake activities following the Loma Prieta event seem to correlate with surface displacement, both driven by the viscoelastic relaxation from upper mantle.
|
| The Postseismic Displacement |
We mainly use GPS data collected by Segall et al. (2000) for the early period (1989.8-1998), and later period (1994-2013) data are obtained from USGS measurements (http://earthquake.usgs.gov/monitoring/gps) (Savage and Svarc, 2010). Figure 1a shows the GPS observed first 5 years, 5-10 years, and 10-15 years postseismic deformation, after removing secular interseismic motion. For the first 5 years, the postseismic displacement (red arrows in Figure 1a) is generally less than 5 cm near the Loma Prieta earthquake area. The postseismic displacement after the first 5 years is significantly smaller (orange and blue arrows in Figure 1a). In addition, there is a change of direction in postseismic deformation after the first 5 years. Segall et al. (2000) estimated time-dependent afterslip on the fault plane using GPS data collected between 1989.8 and 1998.3. They found that the afterslip dominated the postseismic deformation until 1994, which may explain the change of the direction in postseismic deformation 5 years after the main shock.
|
| Viscoelastic relaxation | We consider simple elastic coseismic dislocations to calculate the coseismic stress changes and the postseismic relaxation in a layered viscoelastic representation of the Earth’s lithosphere to evaluate the inferred surface deformation. We assume Earth’s upper crust (0-19 km in depth) as elastic, and the lower crust (19-30 km) and upper mantle (below 30 km) are both viscoelastic. We vary the viscosities of the lower crust and upper mantle between 1017 and 1020 Pa s. The bi-viscous upper mantle with transient (ηK) and steady-state (ηM) viscosities can allow for transient deformation following the Loma Prieta main shock. We calculate the misfit between the GPS time series and the predicted viscoelastic relaxation models to investigate the crustal and upper mantle rheology. Figure 1b and c show the fitting of predicted viscoelastic relaxation to early and late postseismic periods. We only calculate the misfit between 1994 and 2007 in order to avoid the afterslip driven postseismic deformation between 1989.8 and 1994. The best fitting model (Figure 1c) predicts a viscosity of the upper mantle that is about 10 times lower than the lower crust. Our results show evidence that afterslip in the shallower portion of the coseismic fault plane dominates the early (1989.8-1994) Loma Prieta postseismic deformation. The postseismic deformation after 1994 resulted from the viscoelastic relaxation of the upper mantle and lower crust. The predicted upper mantle viscosity is ~1018 Pa s (Figure 1d), which is in good agreement with upper mantle rheology in southern California based on similar approach. |
| Tools | GPS and InSAR observations, forward and inverse elastic and viscoelastic modeling |
| Geographic Location | San Francisco Bay Area |
| Group Members Involved |
Mong-Han Huang, Roland Bürgmann |
| Project Duration | late 2013 to summer 2014 |