
|
|
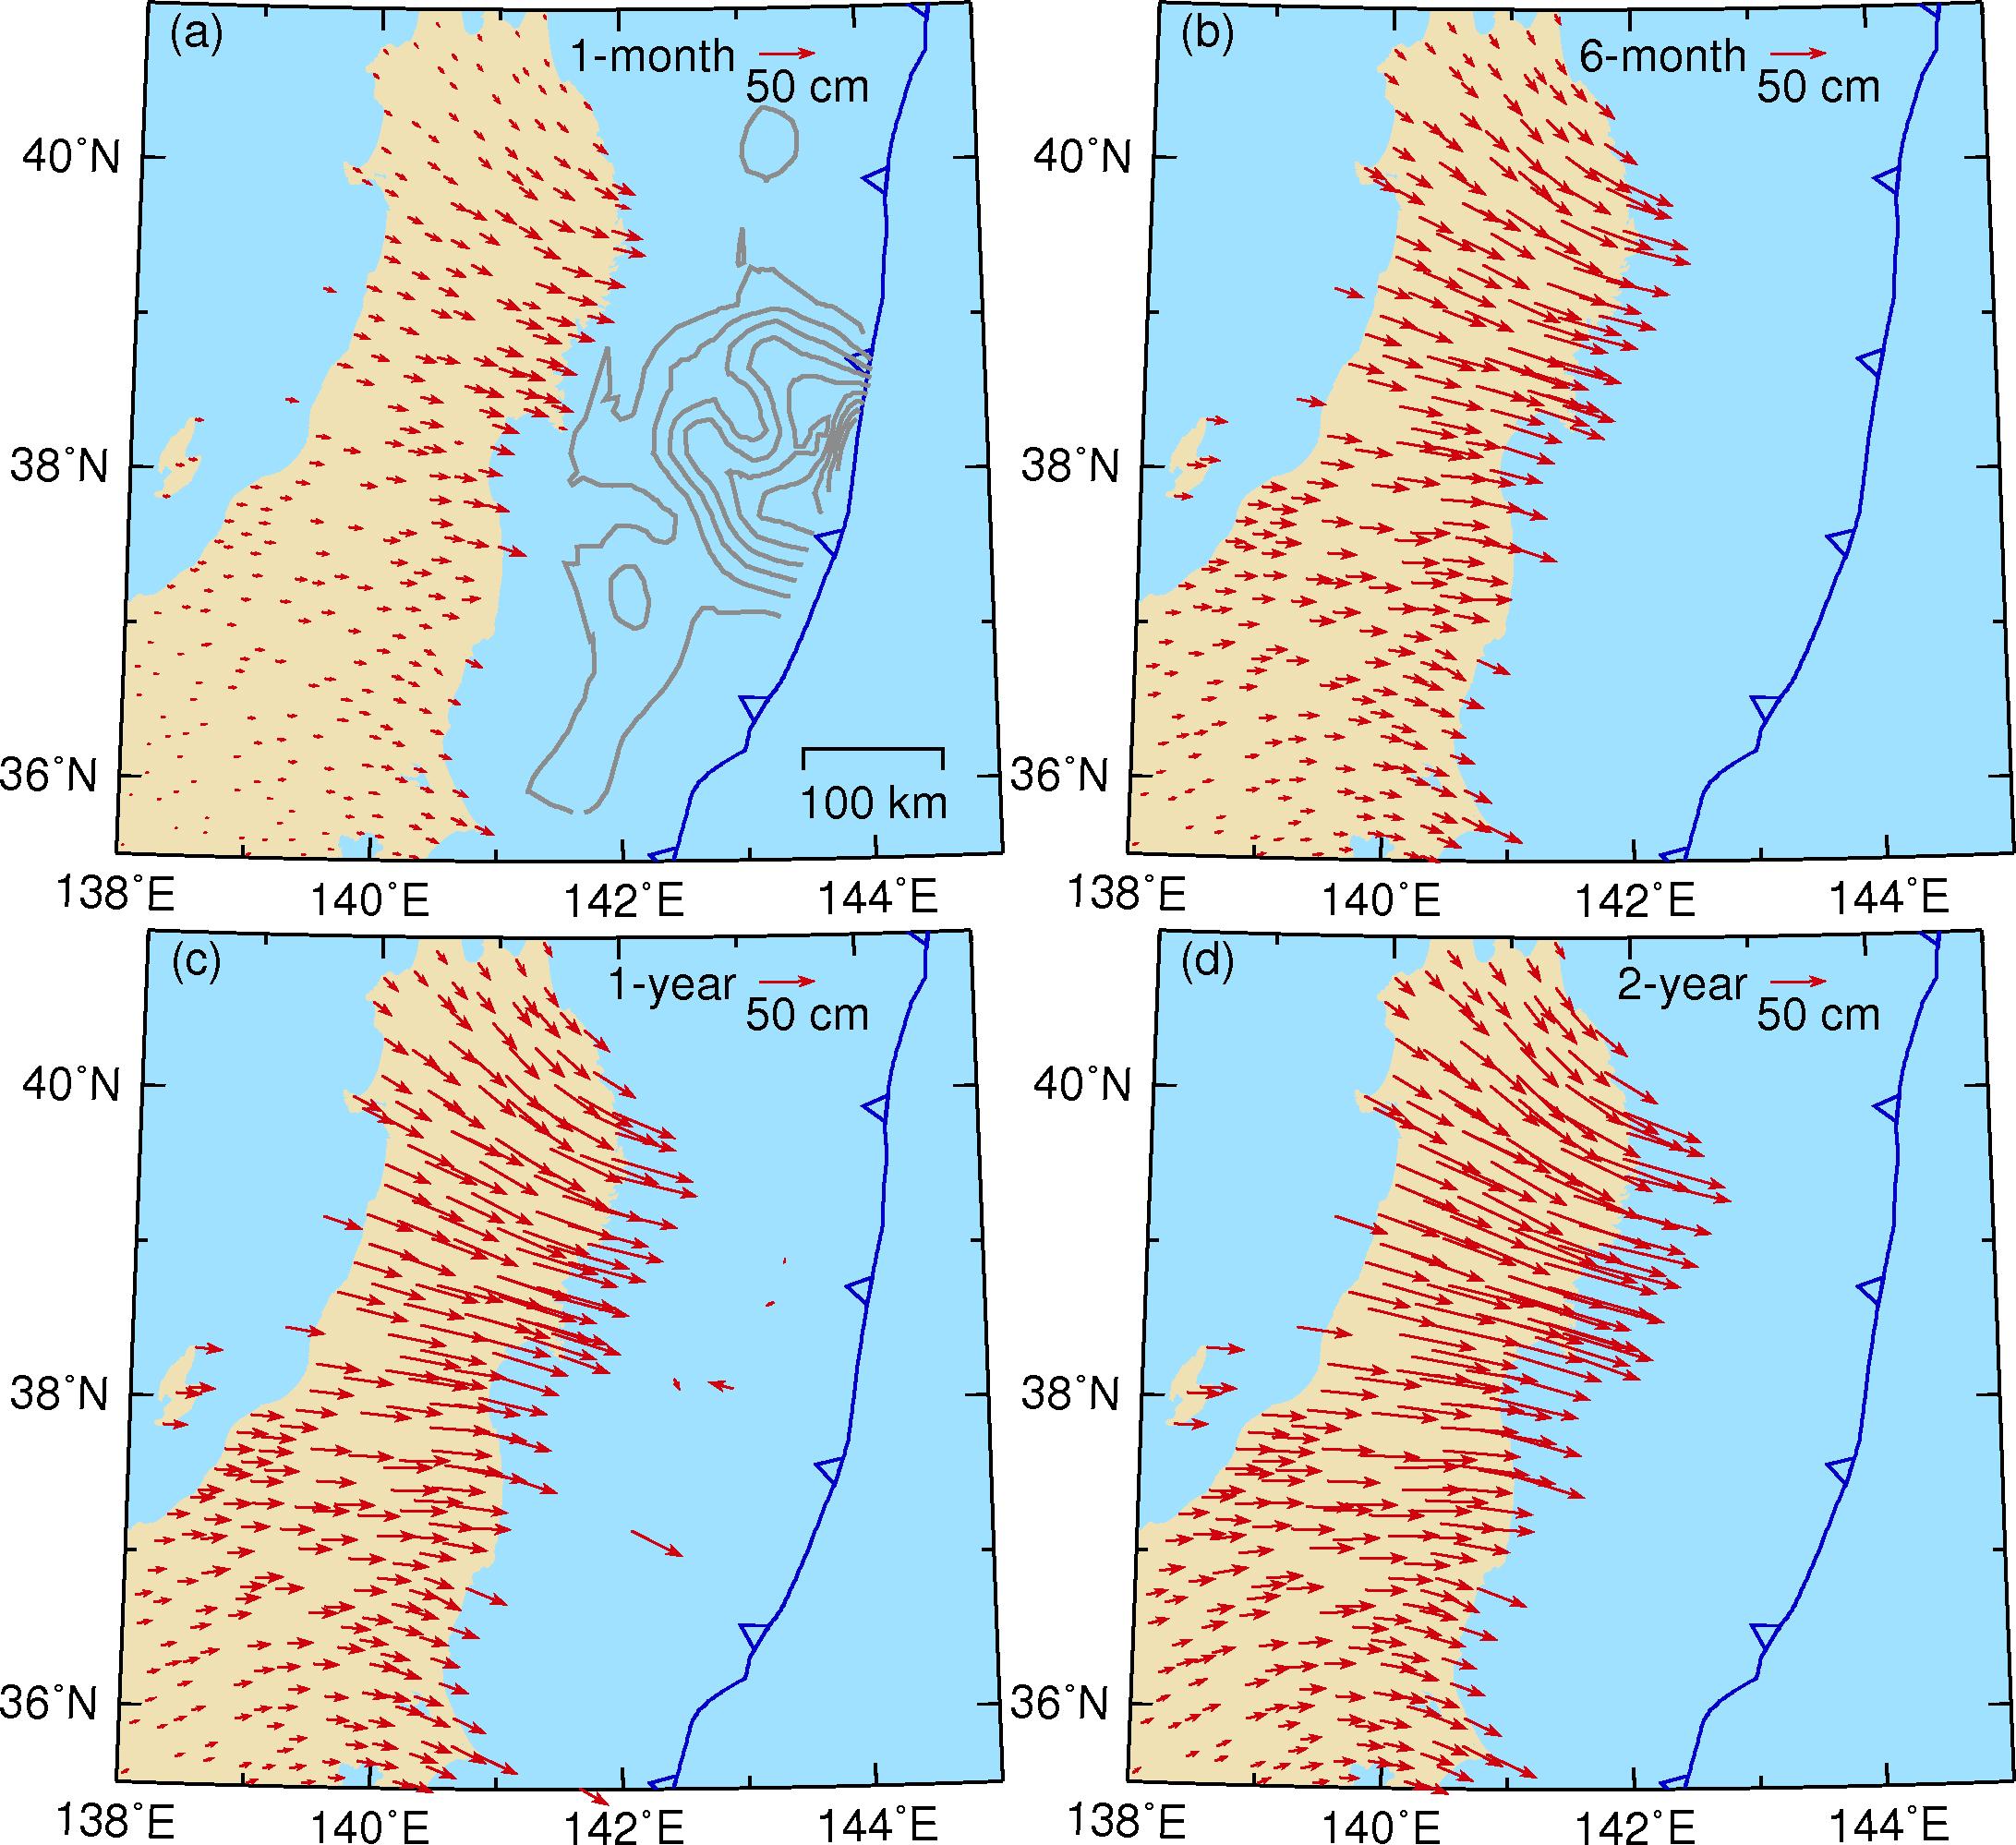
Figure 1. GPS observations in NE Japan. (a) First month postseismic displacements. Contours are coseismic slip distribution from Iinuma et al. (2012). (b) 6-month displacements. (c) 1-year displacements. (d) 2-year displacements.
 (b)
(b)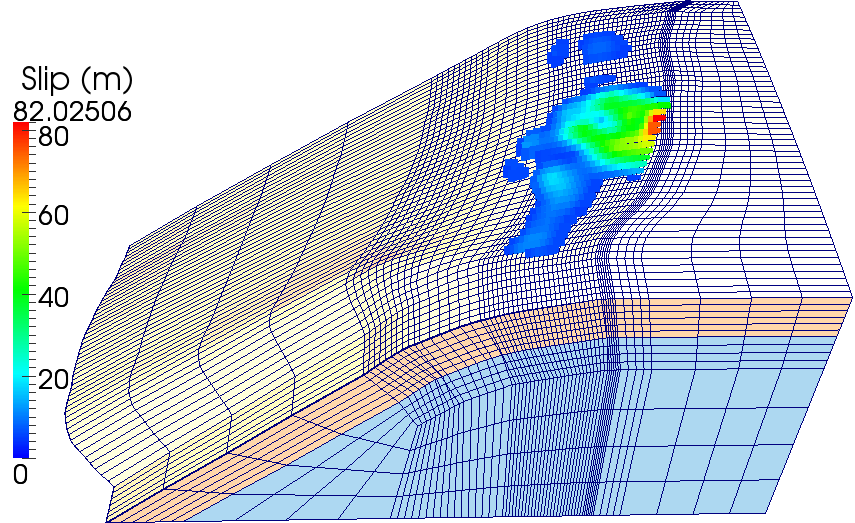
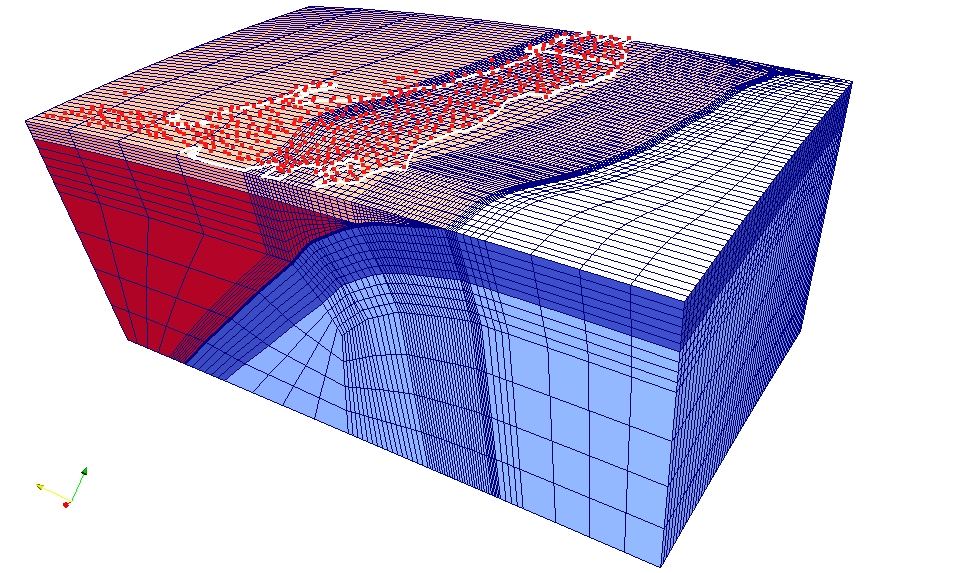
Figure 2. (a) Central part of the finite element mesh. Red and black dots represent locations of land and marine GPS stations, respectively. Thick white lines denotes the coastline. (b) Central part of the mesh with upper plate removed. Colored contours are coseismic slip of the 2011 Tohoku earthquake (Iinuma et al., 2012).
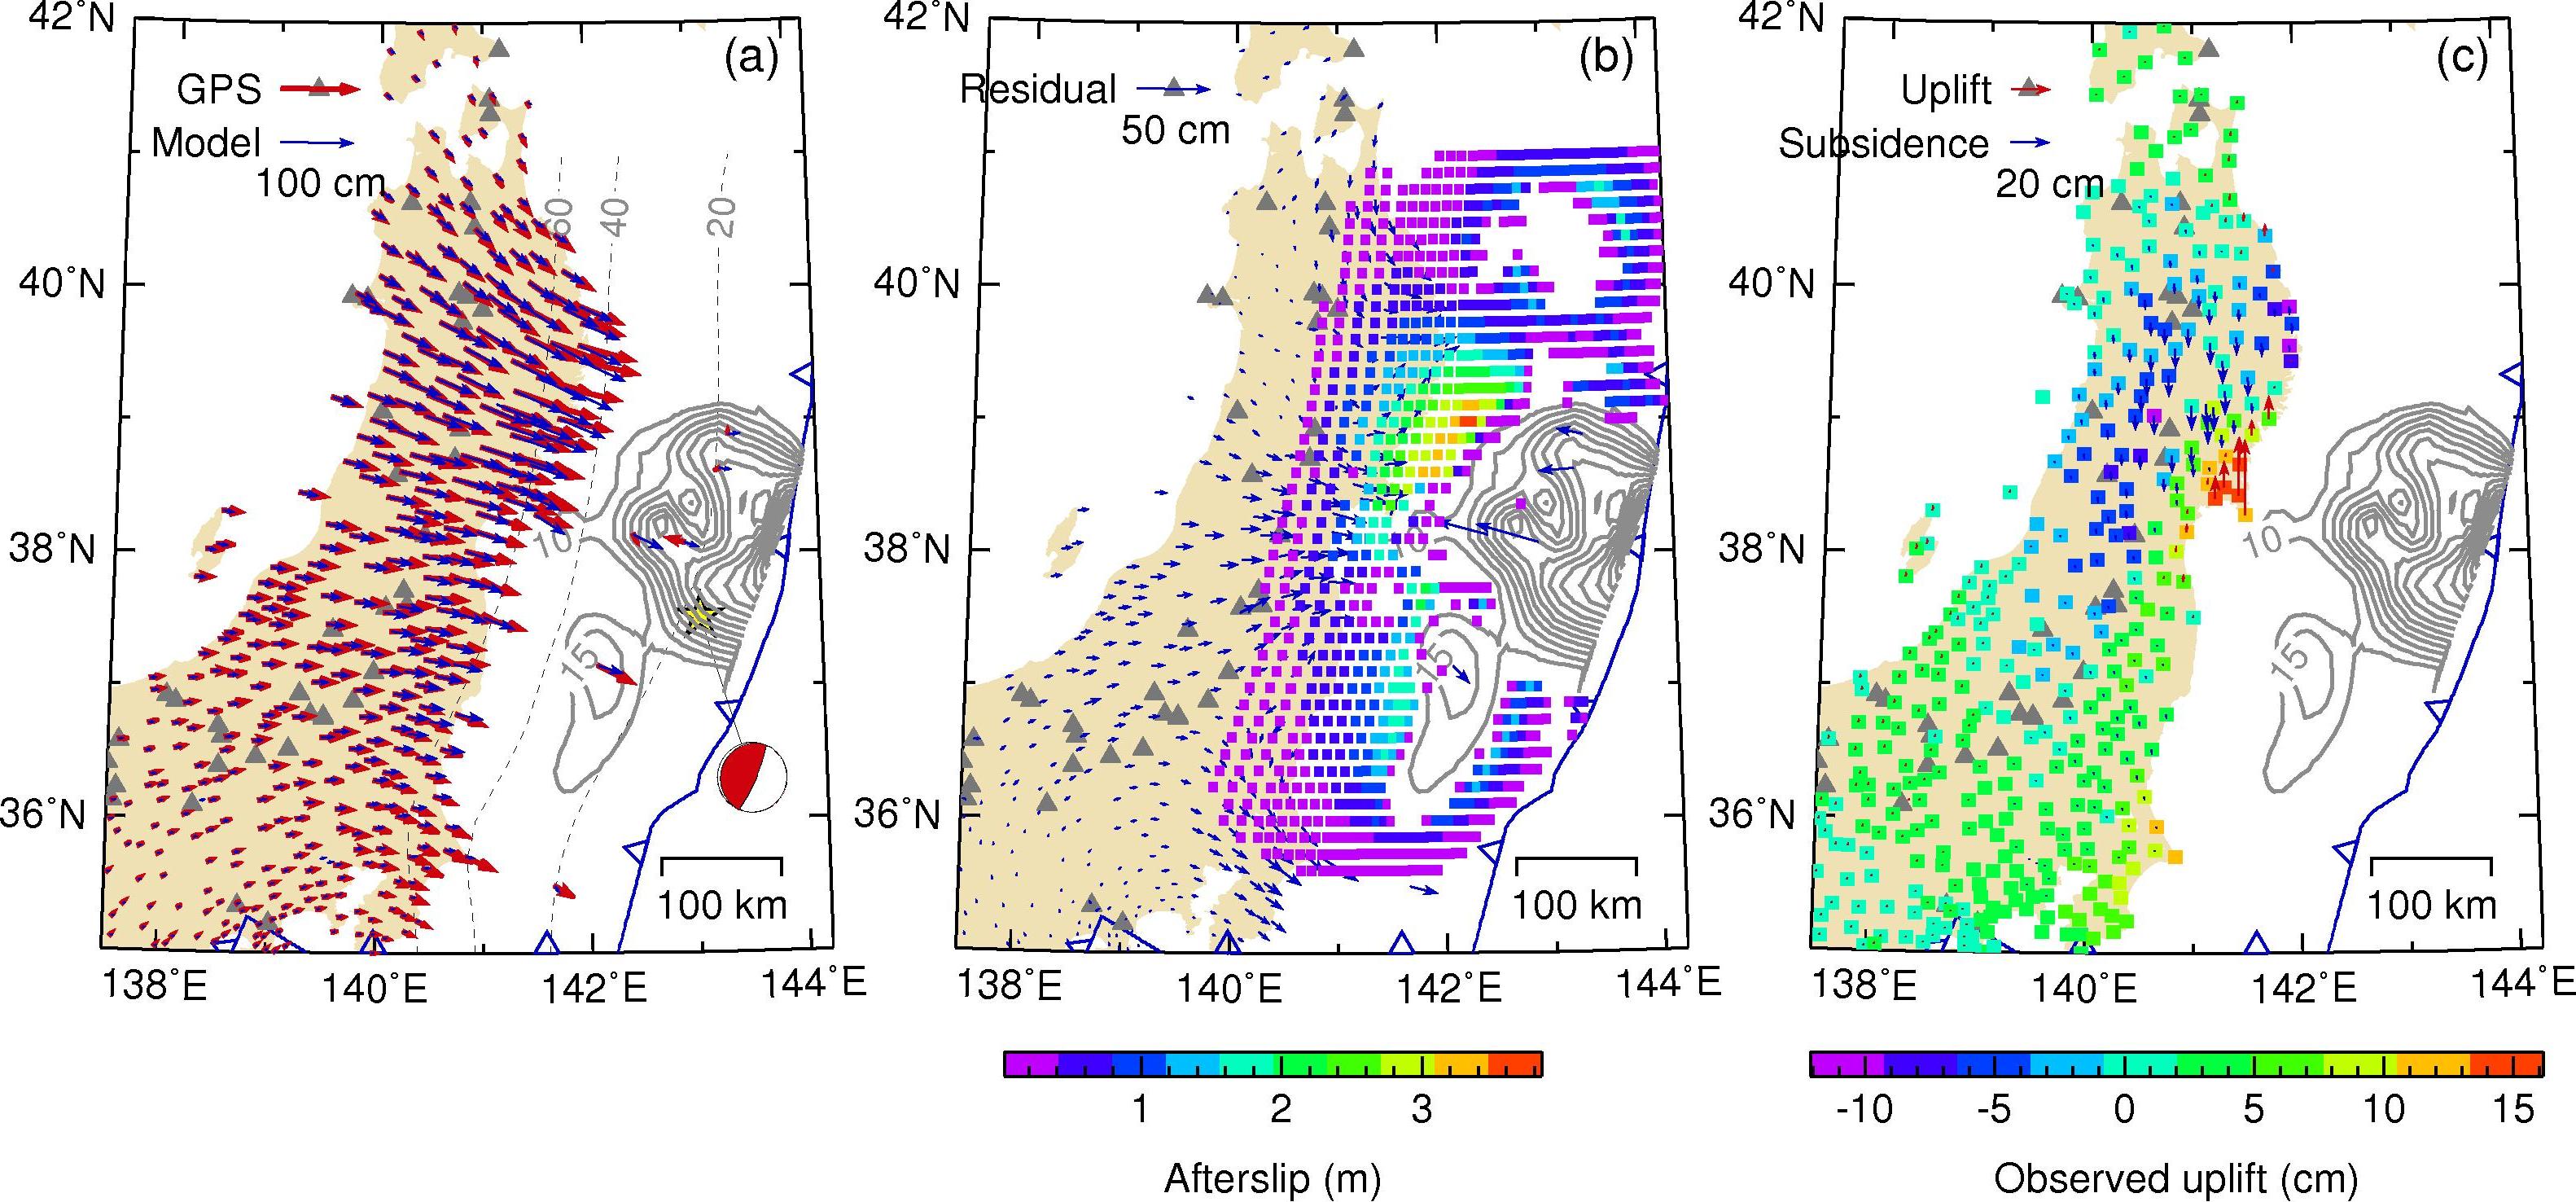
Figure 3. Comparison of GPS observations with model results. (a) One year postseismic displacements. Red and blue arrows are GPS observations and model-predicted displacements, respectively. Contours are coseseismic slip of the 2011 earthquake. (b) Residual between GPS observations and model-predicted results shown in (a). Colored contours represen model-derived afterslip of the fault.(c) Vertical displacements. Red and blue arrows represent model-predicted uplift and subsidence, respectively. Colored rectangulars the represent vertical GPS observations.
| Project Summary |
The surprisingly large Mw9.0 Tohoku earthquake ruptured the interface of the subducting Pacific Plate over an approximately 400-km-long and 200-km-wide area and produced a devastating tsunami, on March 11th, 2011. Land GPS stations have recorded up to more than one meter postseismic displacements in two years since the earthquake (Figure 1). Viscoelastic relaxation in the upper mantle of the shear stresses induced by the earthquake and aseismic afterslip of the megathrust both contribute to the very rapid crustal deformation observed since the earthquake. In this research, we integrate the wealth of geodetic data from NE Japan and modeling experiences developed at other margins to investigate the effects of mantle rheology on ollowing the 2011 earthquake.
|
Model results |
Our model successfully reproduces the first-order pattern of the observed horizontal (Figure 3a) and vertical (Figure 3c) displacements one year since the 2011 earthquake. In particular, the model well predicts the order of magnitude of displacements at five marine GPS sites (Figure 3a). The model has indicated that afterslip of the fault slows down logarithmically with time. The fault undergoes continuous afterslip of up to about three meters in the first six months since the arthquke and up to about four meters in two years.
We use a weak shear zone attached to the fault to simulate the time-dependant afterslip. Our model has determined the steady-state viscosities of shallow (<50 km, seismogenic zone) and deep (50-100 km) shear zone to be the order of 10^17 and 10^18 Pa s, respectively. The steady-state vicosities of the mantle wedge and oceanic mantle are determined to be the order of 10^19 and 10^20 Pa s, respectively. Transient viscosity is assumed to be one order of magnitude lower than that of steady-state viscosity for all the mantle and shear zone units. |
| Tools | GPS data analysis, finite element viscoelastic modeling |
| Geographic Location | NE Japan |
| Group Members Involved |
Yan Hu, Roland Bürgmann |
| Project Duration | In Progress: start of 2013 through 2014 |