
|
|
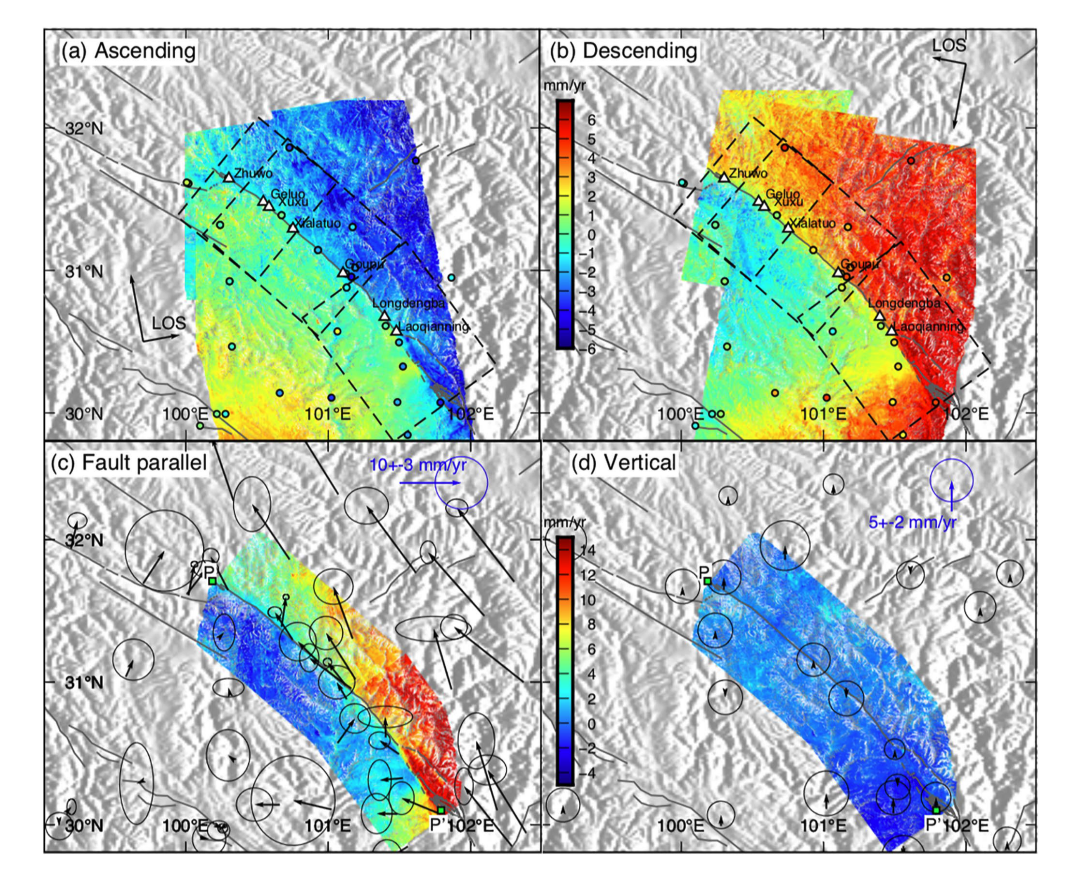
Figure 1. (a), (b): Average LOS velocity maps for (a) ascending track 26 and (b) descending tracks 33 and 135 in the Xianshuihe Fault region. In both (a) and (b), red color represents radar range increase and blue color represents range decrease. Fault-crossing baseline survey sites from Zhang et al. (2018) are denoted with yellow triangles labeled with their station names. Co-registered and projected LOS velocities from GPS measured horizontal velocities from Zheng et al. (2017) are shown with circles using the same color scale. InSAR and GPS velocities are referenced to the Yajiang sub-block (Figure 1). (c)(d): Decomposed velocity maps of (c) fault-parallel and (d) vertical components. In (c), red coloring represents NW motion and blue indicates SE motion. Different fault strikes are used along three segments of the fault, introducing linear discontinuities in the inferred fault-parallel velocity field. GPS vectors are horizontal GPS velocities from Zheng et al. (2017) referenced to the regional Yajiang sub-block. In (d), positive values represent uplift . GPS vectors are vertical GPS velocities from Liang et al., (2013). We subtract 1.41 mm/yr of uplift from the original GPS velocities in the ITRF2008 reference frame to highlight local uplift-rate variations (Liang et al., 2013). Active fault lines are modified from Taylor & Yin (2009), Chevalier et al. (2017), Bai et al. (2018) and Pan et al. (2020).
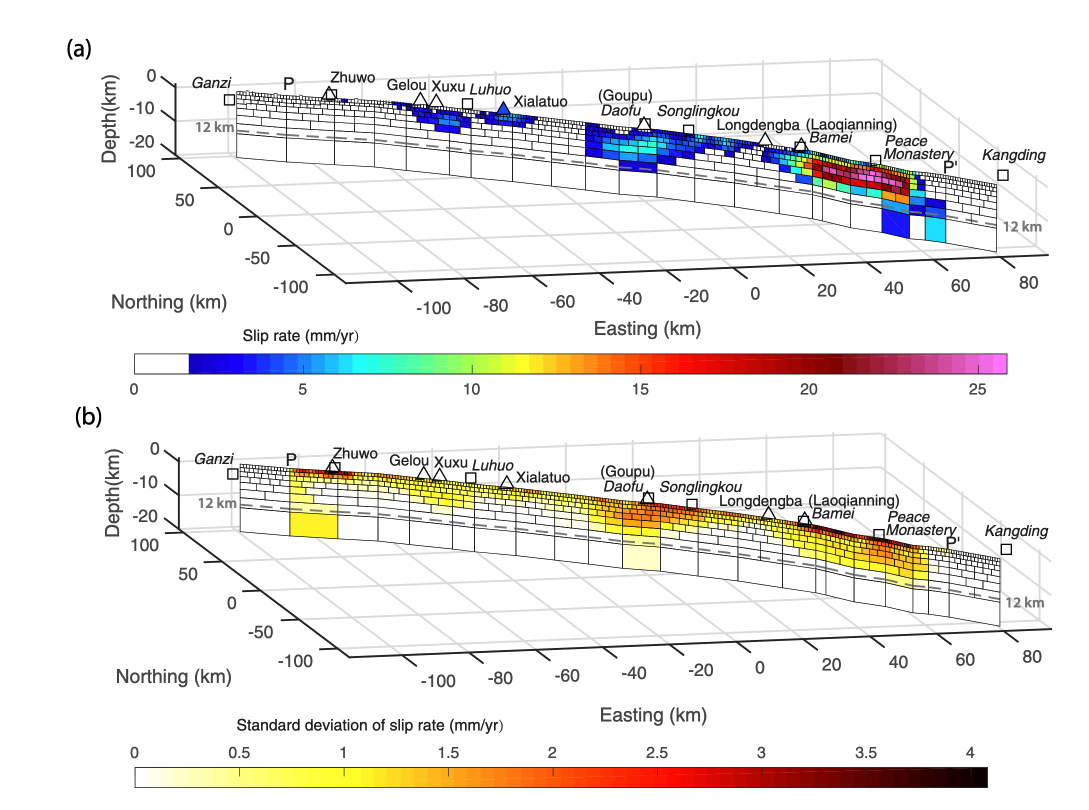
Figure 2. (a) The inverted interseismic shallow slip model using the average velocity map between 2014.12-2019.7 in the Xianshuihe Region. Fault patches are colored by their sinistral slip rates (mm/yr). Patches with slip rate lower than 1.5 mm/yr are colored in white to assist visualization. The model also includes 1000-km-wide deep dislocations below 12 km slipping at 12.1 mm/yr with lateral extensions that go far beyond the fault tips to account for the long-wavelength interseismic strain accumulation (see Figure S8). The inverted slip below 12 km adds to the interseismic deep slip rate, possibly reflecting lower-crustal afterslip following the Kangding earthquake. The locations of P and P’ are marked in Figure 4. Fault crossing baselines from Zhang et al. (2018) are shown as triangles colored by the reported along-strike slip rates (all but one below 1.5 mm/yr). Locations of major cities along the XSF are labeled with squares. (b) Standard deviations of the shallow slip model in (a). The uncertainties are determined by bootstrapping the downsampled InSAR data with replacement for 1000 times and calculating the standard deviation of the slip rates for the 1000 inversions.
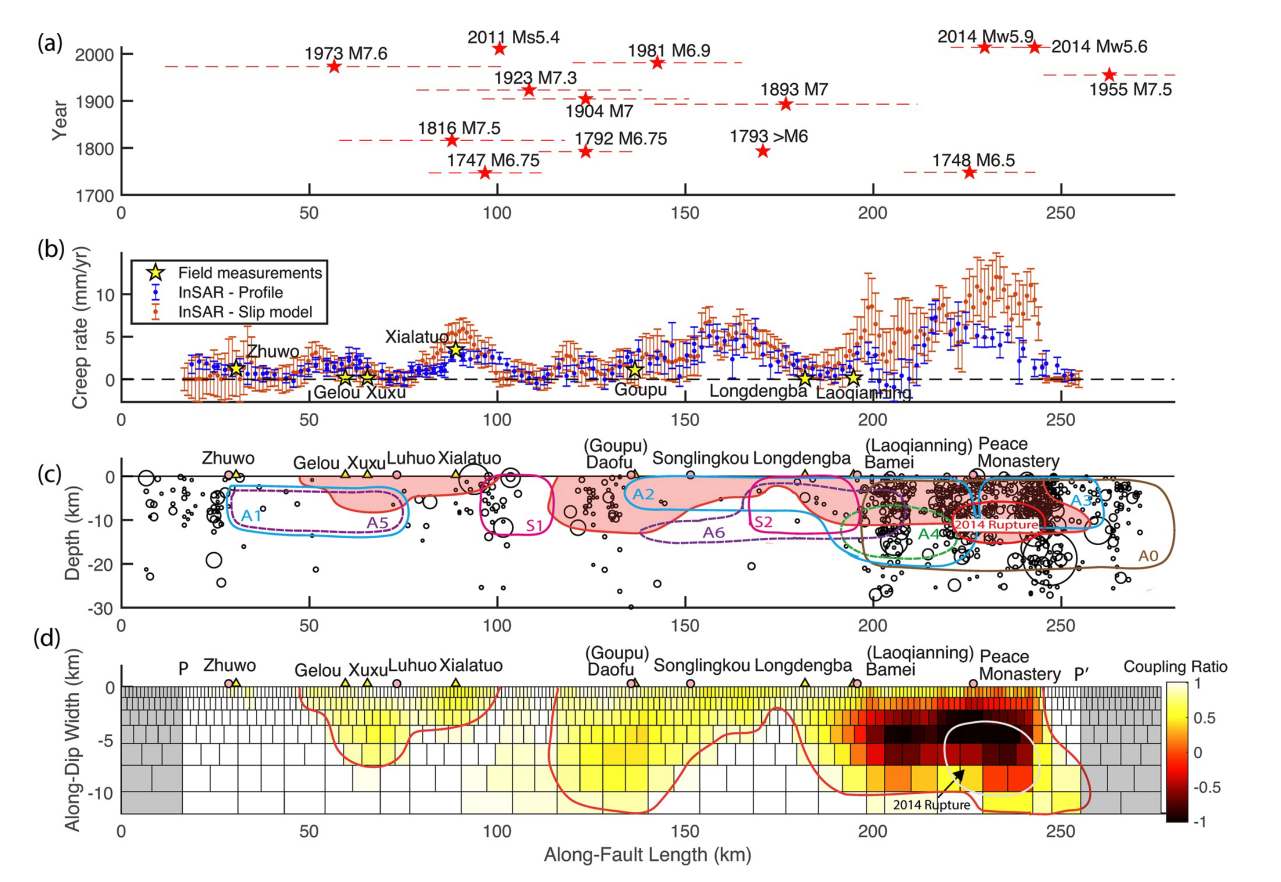
Figuree 3. (a) Spatio-temporal distribution of the historical earthquake ruptures along the XSF. (b) Creep rate variation along the XSF estimated from fault-perpendicular velocity profiles and the distributed creep model. The averaged surface creep-rate measurements (1970s-2010s) from Zhang et al. (2018) are shown with yellow stars. (c) Cross-section of microseismicity and comparisons of identified asperities along the XSF. Black circles show M≥1.5 seismicity within 10 km of the XSF from China Seismic Experiment (2009-2019; Wu et al., 2019). A0: seismicity gap identified by Wen et al. (2008). A1-A3: asperities suggested by Jiang et al. (2015b). A4: asperity proposed by Yi et al. (2005). A5-A6: asperities from Zhang et al. (2018). S1-S2: potential locked asperities identified by this study. The shallow creeping area outlined from the shallow slip model is filled in red. (d) 2D view of the fault coupling distribution between 2014.12-2019.7 with outlined shallow creeping area. The coupling ratio is defined to be one when the fault is fully locked and zero when it is slipping at a tectonic loading rate of 12.1 mm/yr. Negative values indicate creep rates in excess of long-term values. Patches outside of our model domain (PP’) are shaded in gray. We assume fault patches below 12 km are fully uncoupled.
| Project Summary | The left-lateral Xianshuihe Fault is located at the eastern boundary of the Tibetan Plateau and is one of the most active faults in China. It is associated with substantial seismic potential, with more than 20 Mw>6 earthquakes since 1700. The fault has been documented to be creeping at the surface for decades; however, the spatial and temporal distributions of shallow creep along the fault are not well resolved. In this study, we obtain high-resolution interseismic velocity maps along the 350-km-long central Xianshuihe Fault and Interferometric Synthetic Aperture Radar (InSAR) time series along the Kangding segment using ascending and descending Sentinel-1 data. The InSAR data reveal multiple creeping sections and the estimated surface creep rates show high along-strike variability. A coupling model characterizes the distribution of creep with depth. The seismic potential of apparent rupture asperities along the Xianshuihe Fault is further refined by considering fault-crossing baseline data and the distribution of historical ruptures and microseismicity. Moreover, a stress-driven afterslip model of the observed accelerated creep around the Mw 5.9 2014 Kangding rupture indicates substantial shallow afterslip, which provides further constraints on the distribution of locked and creeping patches along this section of the Xianshuihe Fault. |
| Tools | InSAR, GPS, fault-crossing baseline |
| Geographic Location | Tibetan Plateau, China |
| Group Members Involved | Yuexin Li <Email> <Personal Web Site> Roland Bürgmann |
| Project Duration | 2018 - 2020 |
| Reference | Li & Bürgmann, JGR, 2021 <Link> |