
|
|
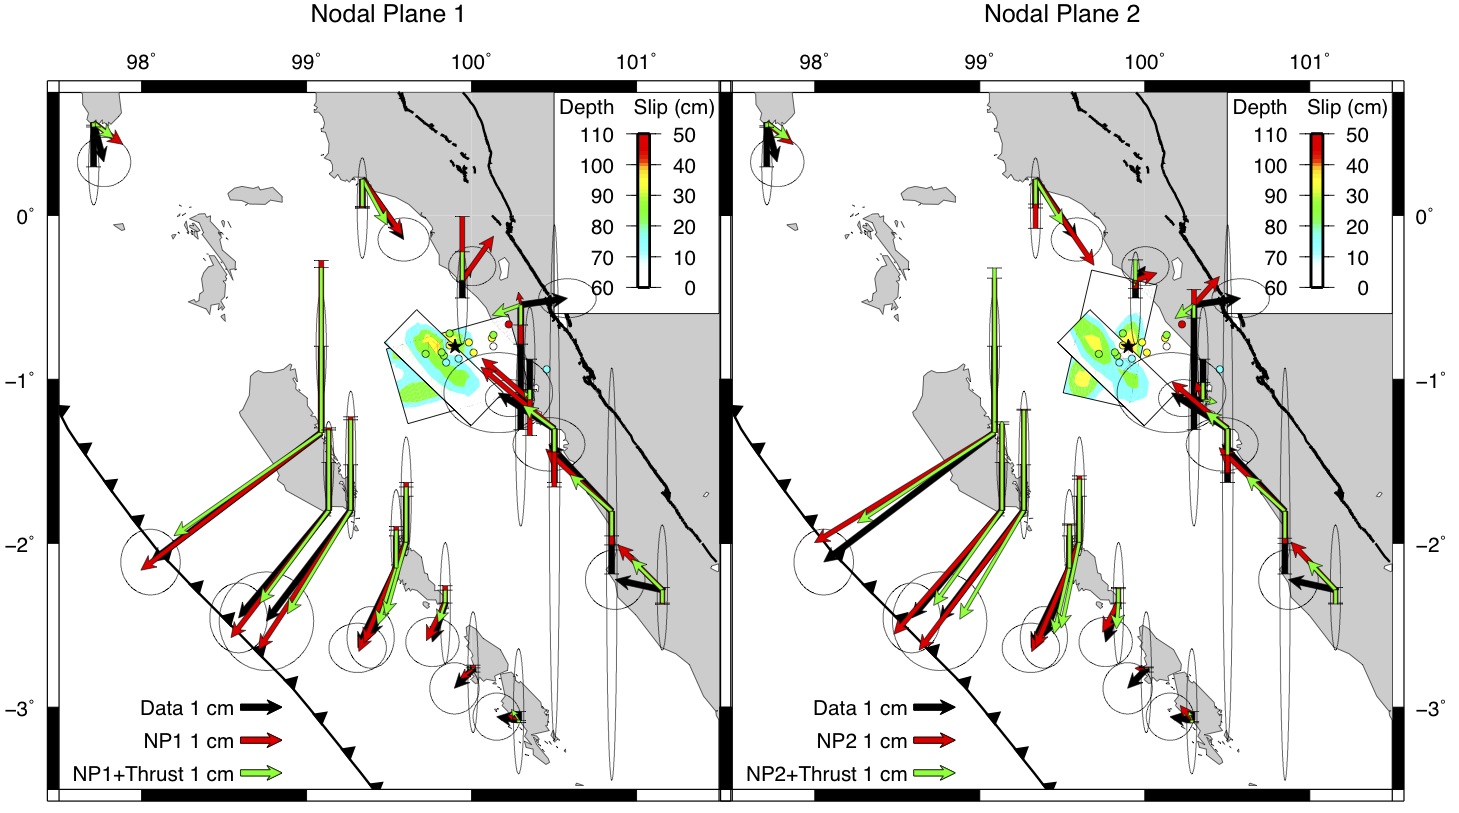
Figure 1. Comparison of geodetic data with the one-plane joint inversion models (shown in Figure 2) and the two-plane joint inversion models. The two-plane slip distributions are plotted.
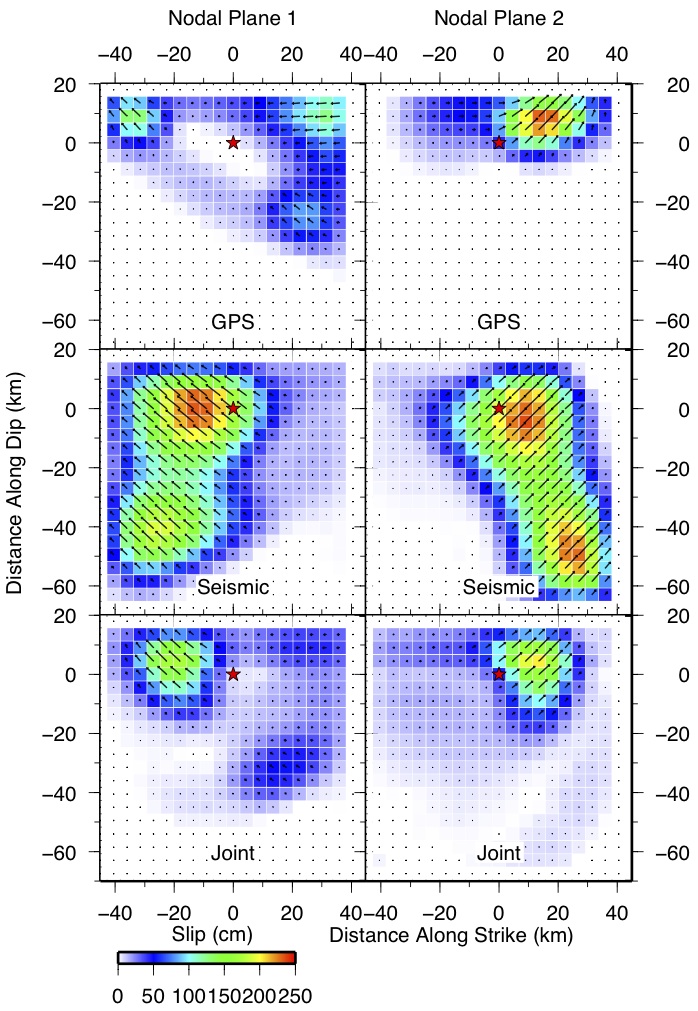
Figure 2. Left: Slip models for the east-west nodal plane using GPS, seismic, and joint data. Right: Slip models for the north-south nodal plane. The hypocenter is marked with a star and the arrows indicate the variable inverted rake direction.
| Project Summary |
The Mw 7.6 Padang earthquake occurred on 30 September 2009 offshore of central Sumatra (Figure 1). Seismicity in the Sumatra region is driven by the oblique subduction of the Indian and Australian plates beneath the Burma forearc block and Sunda plate at the Sunda trench. The Sunda megathrust has been extremely active ever since the 2004 Mw 9.2 Sumatra-Andaman earthquake, with additional megathrust earthquakes in 2005, 2007, and 2010. The last remaining section of the Sunda megathrust without a modern great earthquake is the Siberut segment, which lies offshore of Padang. Thus, it is especially important to understand the fault mechanism of the 2009 Padang earthquake in order to assess how it affects the stress levels on the Siberut segment of the megathrust.
The Padang earthquake is an unusual event because it likely ruptured the subducting Australian plate. The USGS locates the earthquake at 81 km depth, 250 km from the Sunda trench, where the (Hayes et al., 2009) Sunda plate interface model places the interface at 67 km depth. The Padang earthquake rupture mechanism is also consistent with an intraslab event. The strike is approximately perpendicular to the trench with significant left-lateral strike-slip motion. Possible candidates for the rupture plane could be subducted paleo transform faults, fractures, or ridges. We attempt to resolve the fault plane by using regional broadband seismic data, GPS data, and aftershock locations.
|
| Data and Processing |
There are 7 three-component broadband stations located within 750 km of the epicenter, with useable data available on IRIS, operated by the GEOFON network, Malaysian National Seismic Network, and the Singapore National Network. For our finite fault inversions, both the displacement waveform data and the Green's functions are bandpass filtered between 0.01 to 0.3 Hz. The maximum waveform amplitude for each component varies from about 0.5 to 1.5 cm at this frequency range. We also include data from 18 three-component permanent GPS stations, located within 380 km of the epicenter, from the SuGAr and ENS-INSU regional networks (Figure 1).
|
| Inversion Method and Results |
For both our finite fault inversions and moment tensor inversions, the Green's functions are calculated using a 1D frequency-wavenumber integration method (Saikia, 1994). Our starting earth model consists of the Lange et al. (2010) velocity structure, PREM densities, and typical crustal attenuation values. To invert for finite fault slip, we use a least-squares inversion method that employs simultaneous smoothing and dampening (e.g. it Kaverina et al., 2002). The fault geometry is based on the GCMT moment tensor solution, with variable rake. We allowed a 90 km x 90 km fault plane, with the hypocenter located in the central position along strike and 4 patches downdip, to prevent slip propagating to depths shallower than the plate interface.
The initial seismic finite fault inversion for both nodal plane (NP) geometries does a fairly good job of fitting the waveform amplitudes and polarities. However, all of the synthetics have significant phase shifts on the order of 10 seconds that cause the variance reductions to be negative. The highest variance reductions for each NP geometry are achieved using the Lange model with a uniform 10% increase in velocities across all depths. NP1 has a variance reduction (VR) of 54% and NP2 has a VR of 51%. For both inversions, there are two high slip regions, one near the hypocenter and the other 40 km downdip (Figure 2). The GPS-only inversions have shallower slip and less moment than the seismic-only inversions. The NP1 inversion is rougher than the NP2 inversion, with three separate high-slip patches. The NP1 model has a VR of 84% and the NP2 model has a VR of 81%. The joint inversions both have one 40 x 30 km high-slip patch, southwest of the hypocenter, with moment similar to the GPS-only models. The joint models still fit the GPS data well, at VR = 73% for NP1 and 75% for NP2. However, they do not fit the amplitudes of the seismic data and the VR for NP1 drops to 35% and to 31% for NP2. We also tested two-fault plane models that include slip on the megathrust structure, above the hypocenter, similar to the Mw 8.0 2000 Enggano earthquake (Figure 1). These joint models fit the GPS data equally well, have larger moments equal to Mw 7.7, and better fits to the seismic data with NP1 VR = 54% and NP2 VR = 53%.
|
| Discussion |
Our joint inversions of the Padang earthquake, using both regional seismic waveform and geodetic data, have shown that the east-west NP1 has a few percentage better fit to the data than the north-south NP2. In addition, the NEIC aftershock sequence better aligns with the strike and depth range of the east-west plane (Figure 1). Allowing slip on both the intraslab fault and the megathrust improves the fit to the seismic data, however the NEIC aftershock catalog does not include events at the depth range of the plate interface. Therefore are preferred fault model is slip on the east-west nodal plane, primarily southwest of the hypocenter.
|
| Tools | ***tools*** |
| Geographic Location | Central Sumatra |
| Group Members Involved |
Kelly Wiseman <Email> <Personal Web Site> Roland Bürgmann |
| Project Duration | 2009-present |
| More Information | < ***link description*** > |
|
|