
|
|
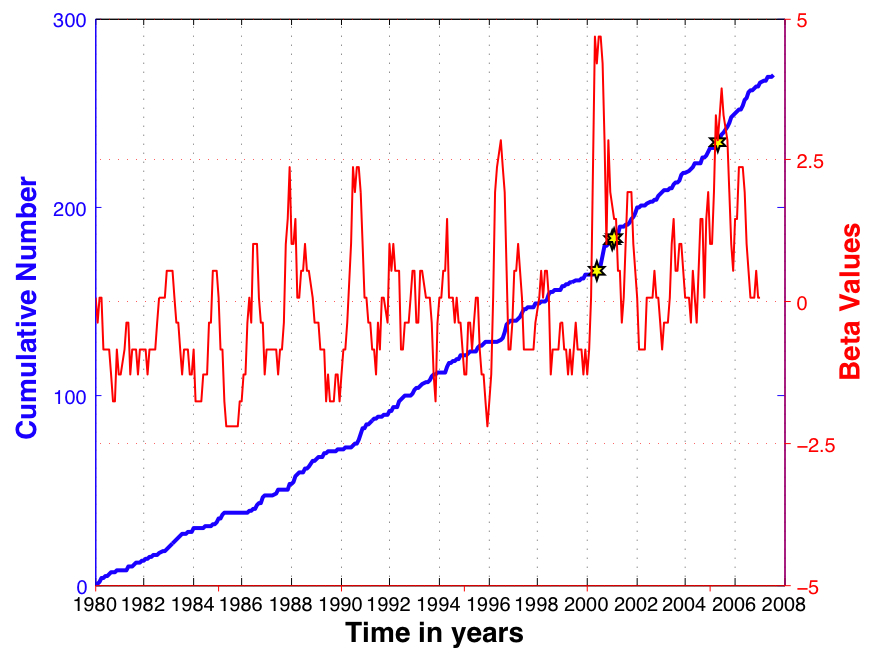
Figure 1. Beta values in the 2007 high-slip region are plotted in red. The blue line indicates the cumulative number of M > 4.7 earthquakes since 1980. The yellow stars indicate earthquakes with M > 6.5
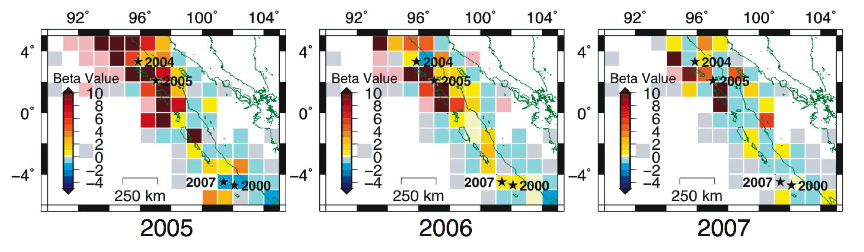
Figure 2. Beta values showing the relative change in seismicity following the 2004 earthquake compared to the time period 1980-2004. The pink squares signify regions where there were no earthquakes during the preseismic period.
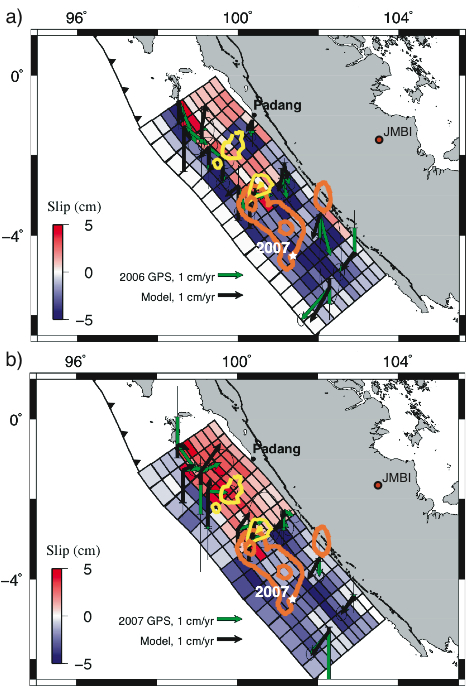
Figure 3. Inverted slip on the Sunda megathrust, for a) 2006, and b) 2007 up to the September 12th earthquake. Positive slip values indicate aseismic slip on the megathrust. The 1-m and 5-m slip contour lines for the 2007 Mw 8.4 earthquake are shown in orange and for the Mw 7.9 aftershock in yellow (Konca et al., 2008).
| Project Summary |
The September 12, 2007 Sumatra Mw 8.4 earthquake initiated 750 km south of the 2005 epicenter. Twelve hours later a deeper Mw 7.9 aftershock ruptured further to the north. Their occurrence, close in time and space to the 2004 Mw 9.2 Sumatra-Andaman earthquake, 2005 Mw 8.7 Nias earthquake, and 2000 Mw 8.0 Enggano earthquake, suggest the possibility of these being triggered events. Coulomb failure stress models have shown that the 2000 earthquake had a larger impact at the 2007 hypocenter than the 2004 and 2005 earthquakes, and could have contributed to its southern location. We investigate seismicity changes and GPS-measured velocities, in the 2007 rupture region, for alternative triggering evidence.
|
| Seismicity Rate Change |
We investigate seismicity rate changes in Southern Sumatra using the standard Beta-statistic approach (e.g. Reasenburg & Simpson, 1992). Beta will be positive when the postseismic rate is higher than the background seismicity rate, and negative when it is lower. Our earthquake catalog consists of the preferred events from IRIS SeismiQuery (http://www.iris.washington.edu/SeismiQuery/sq-events.htm). The magnitude of completeness for this catalog, which starts in 1980, is 4.7. In order to reduce the effect of aftershocks, we use ZMAP (Wiemer, 2001) to decluster our catalog.
The number of annual earthquakes increased greatly for the time period following the 2000 earthquake and before the 2004 earthquake. When calculating an average value of beta for the 2007 high-slip region, approximated by longitude 99° - 102.5° and latitude 1° - 5° S, the largest two spikes in beta occur after the 2000 and 2005 earthquakes (Figure 1).
Figure 2 shows beta calculated for 1 year time intervals and spatially binned into 1\mydeg squares. In general, the seismicity level has been extremely elevated in Western Sumatra and the offshore region north of the equator. In 2005, there was a cluster of aftershocks near Siberut Island, as evident by beta > 10. From 2005-2007, there was a more moderate increase in seismicity near the Mentawai Islands of Sipora, North Pagai, and South Pagai, regions that slipped during the 2007 earthquake sequence. In 2005, there were moderate seismicity increases of up to beta = 4, in the 1° squares surrounding the 2007 hypocenter. There was a slight decrease in seismicity in the squares containing the 2007 and 2000 epicenters. In 2006, the seismicity increased in the 2007 and 2000 squares, but decreased significantly in the surrounding region. The beta values continued to decrease down to average levels during the first 9 months of 2007, before the September earthquake. If one compares the post-2004 seismicity levels with just the 1980-1999 catalog, thereby removing the effect of the 2000 earthquake, the seismicity levels are significantly higher in the epicentral region.
|
| Aseismic Slip on the Megathrust |
GPS-measured velocities in Southern Sumatra have been centimeters above their interseismic rates during the years following the 2004 earthquake (Sumatran GPS Array data). Figure 3 shows the 2006 and 2007 (up to the September earthquake) GPS velocities in the 2007 high-slip region, with horizontal and vertical interseismic velocities removed (Apel et al., 2006; Natawidjaja et al., 2007). We invert these GPS velocities for dipslip motion on the Sunda megathrust. The 2006 and 2007 inversions reveal an increased level of coupling on the deeper portion of the seismogenic zone, from 15-75 km depth, northwest of the Mw 8.4 high-slip patch. In addition, there was centimeters of aseismic reverse-slip over the region that slipped during the 2007 main event.
|
| Discussion and Future Work |
The 2007 earthquake location may be the result of delayed dynamic triggering from the large number of earthquakes following the 2000 and 2005 earthquakes. The increased level of seismicity may be associated with the observed aseismic slip transients, as in the case of the afterslip following the 2005 earthqukake. More stress modeling is needed to determine whether this observed aseismic slip contributed significantly to the timing and location of the 2007 earthquake.
|
| Tools | ***tools*** |
| Geographic Location | Southeast Asia |
| Group Members Involved |
Kelly Grijalva <Email> <Personal Web Site> Roland Bürgmann |
| Project Duration | 2007-present |
| More Information | < ***link description*** > |
|
|