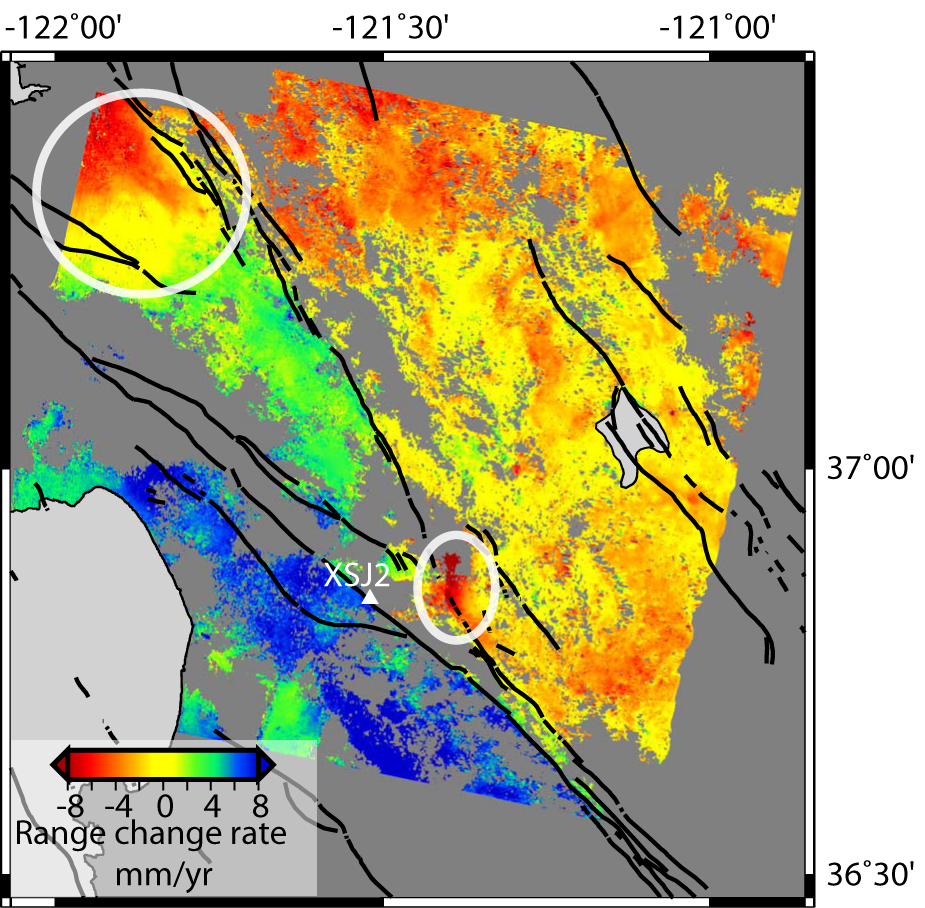
InSAR stack from data spanning 5.75 years, scaled to
yearly rate. White circles outline the Hollister and Santa Clara
Valley Basins where groundwater recharge results in non-tectonic
uplift. These and other areas located on Quaternary sediment were
removed before the model inversion. White triangle is the location of
creepmeter XSJ2.
|
The San Juan Bautista segment of the San Andreas fault is an area of
moderate seismicity that forms the transition zone between the
creeping section and the locked Santa Cruz segment. We examine current
creep on the San Juan Bautista segment using space geodetic data to
determine whether it allows a similar size and rate of earthquake
production as seen in the historic record. InSAR data is taken from a
stack of nine interferogram pairs made using ERS1 and ERS2 data
collected between 1995-2001. We use a stack of small time span (less
than 1.25 years) pairs because interferograms in this area become
completely decorrelated when they span much more than two years. We
choose the stacked interferograms such that the slave in one pair is
the master in the next to remove the atmospheric errors from all but
the very first and very last scenes. Our stack is then, in effect, a
six year interferogram. Our model includes deep slip on the regional
fault network, shallow creep on the nearby Calaveras fault and
distributed creep on the San Juan Bautista segment. We find that below
3 km depth, the creep rate falls off considerably, causing a low slip
zone at mid-seismogenic depths in the northern part of the San Juan
Bautista segment that may represent the source region for some of the
19th century earthquakes.
|
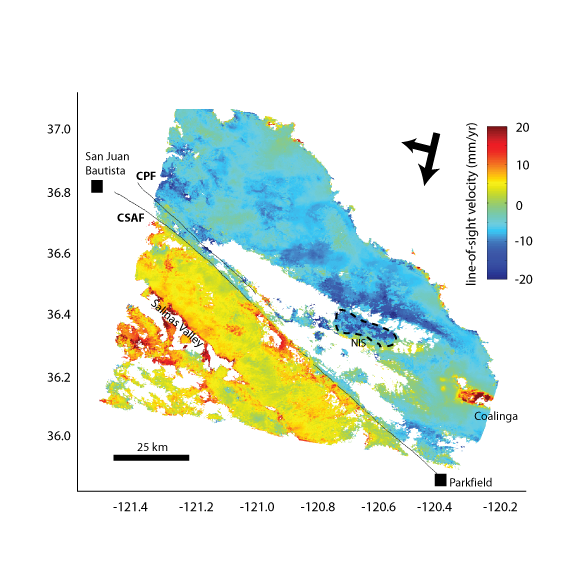
Stack of 12 descending ERS interferograms made from
SAR scenes (track 27, frame 2781) acquired between May 1992 and
January 2001. Fault traces for the CSAF and Calaveras-Paicines Fault
(CPF) are marked. Arrows show satellite ground track and look
direction. Dashed black line marks outcrop of New Idria serpentinite
(NIS). The enhanced positive range change in the Salinas Valley is
likely due to agricultural activity, and the anomaly at Coalinga is
probably due to oil pumping. |
We use ERS InSAR measurements to record spatial variations in creep
rate along the creeping segment of the San Andreas Fault, California,
between 1992 and 2001. An interferometric stack is constructed from
twelve interferograms which show good coherence. For the decade of
observation, the total right-lateral offset across the fault is ~32
mm/year. Along most of the length of the creeping segment, this offset
occurs within a narrow (< 2 km) zone close to the fault trace, which
indicates that shallow creep occurs. In the northern part, a minor
part of the offset is taken up by the Calaveras-Paicines Fault, which
comes very close to the San Andreas Fault, and so the deformation
appears more distributed. In general, the observed rates of surface
creep are consistent with those obtained by several other studies for
a longer and/or earlier period of time, using different geodetic
methods. This suggests that average creep rate has been constant over
a period of almost four decades. We invert our InSAR measurements, as
well as GPS velocities from Plate Boundary Observatory permanent sites
and various campaigns, for the sub-surface slip rate on the creeping
segment. Along-strike moment release due to creep in the seismogenic
layer is approximately inversely correlated with a profile of seismic
moment release, for all earthquakes that occurred during the time
covered by the stack. This may be a consequence of small earthquakes
occurring on patches that slip more slowly, perhaps on account of
minor asperities or different physical properties at the fault
interface.
|