UC Berkeley Seismological Laborarory Moment Tensor Homepage

Automatic Finite-Source Modeling at Berkeley

Within minutes after the occurrence of large earthquakes in central and northern California the Berkeley Seismological Laboratory (BSL) routinely determines finite-source models to correct ShakeMaps for rupture finiteness and for rupture directivity.
The multistep method,described in Dreger and
Kaverina, 2000, is illustrated in Figure 1.
The first step involves the determination of the seismic moment tensor.
The second step involves testing line-source models for a range of rupture velocity to
quickly get the orientation of the best moment tensor nodal plane for the event. The best line-source model
for the Mw 6.5 San Simeon Mw 6.5 Parkfield indicated that the slip was largely located
southeast of the epicenter (Figure 2). These line-source results were then used to
update the ShakeMap to take into account rupture finiteness (Figure 3; upper right panel).
The upper left panel shows the automatic point-source ShakeMap. The lower left panel
shows the ShakeMap that includes non-realtime near-fault data. This map was prepared
two days after the event. The final ShakeMap is shown in the lower right. This map
includes both the near-fault data and the rupture finiteness. The finite-source model
corrected ShakeMap (upper right panel) was computed within several hours of the earthquake and assisted in the characterization of the extent of strong shaking and damage
estimates (CISN report).
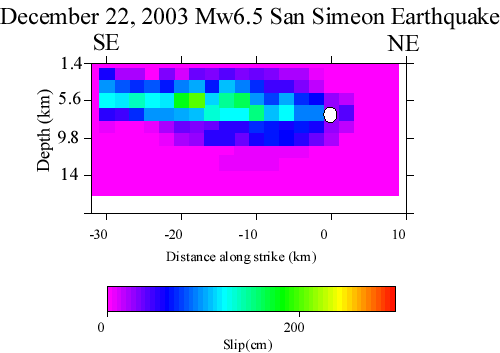
The third step involves inverting for a planar slip model using the orientation determined
in the line-source modeling step. The plane slip model for the San Simeon
earthquake that combines seismic waveform and GPS deformation data is shown
in the above figure. A detailed description of this modeling can be
found in the BSL 2004 Annual Report.
The final step in the processing involves the simulation of near-fault strong ground
motions based on the obtained slip distribution. Figure 4 shows the results of such
a simulation for the San Simeon earthquake (top panel), and a hypothetical vertical
strike-slip event in the same location with identical kinematic source model. The simulated
motions are for a rock site, and the contours show peak ground velocity (PGV) in
intervals of 5 cm/s beginning with 5 cm/s. Note that the hypothetical strike-slip earthquake has
nearly three times the PGV in some regions and the area of greater than
10 cm/s PGV is nearly four-fold. This figure illustrates the relatively mild
directivity of a laterally distributed reverse slip rupture (slip direction is
perpendicular to the rupture direction) compared to the maximum
directivity case in which the rupture and slip directions are the same.
References Related to this Project
Dreger, D., and A. Kaverina ,
Seismic remote sensing for the earthquake source process and near-source strong
shaking:
A case study of the October 16, 1999 hector mine earthquake,
Geophys. Res. Lett., 27, 1941-1944, 2000. (pdf)
Hardebeck, J.L., J. Boatwright, D. Dreger, R. Goel, V. Graizer, K. Hudnut, C. Ji
, L. Jones, J. Langbein,
J. Lin, E. Roeloffs, R. Simpson, K. Stark, R. Stein, J.C. Tinsley,
Preliminary report on the 22 December 2003, M 6.5 San Simeon, California earthqu
ake
Seism. Res. Lett., 75, 155-172, 2004.
Kaverina, A., D. Dreger, and E. Price, Bull. Seism. Soc. Am., 92, 1266-1280, 2002.
(pdf).


