
| Home |
| Research |
| Downloads |
| Publications |
| Teaching |
| People |
| Press |
| Allen CV |
| Seismo Lab |
| Earth & Planetary |
| UC Berkeley |
|
USEFUL IMAGES, VIDEOS AND PRESENTATIONS |
|
UserDisplay v2.4 video captures - Feb 2013 | |
|
The M3.5 Aromas earthquake (April 13, 2012) occured just east of Santa Cruze not far from the epicenter of the 1989 Loma Prieta earthquake. ShakeAlert delivered an alert with an initial magnitude estimate of 3.2 climbing to 3.4 in 2 sec. The warning appeared in the UserDisplay (in Berkeley) with 25 sec of warning. Although this event did not generate any felt shaking in the Bay Area, it demonstrates the speed of the current ShakeAlert system. In a repeat of the Lama Prieta earthquake, ShakeAlert could provide ~20 sec of warning to San Francisco and Oakland. Credit: Richard Allen/UC Berkeley |
Simulated UserDisplay warning in Berkeley for a repeat of the Loma Prieta earthquake. This window would pop-up on your computer desktop and count down until the shaking is felt at your location. The user location is shown by the house, set to San Francisco in this video. The estimated intensity of shaking (moderate in this case) and the countdown are specific to the user location. Credit: Richard Allen/UC Berkeley |
|
Capitol Hill Briefing - Earthquake early warning - September 28, 2012 |
|
This 10 minute presentation provided an overview of the current status of early warning in California. It was was part of a USGS organized briefing on Capitol Hill to staffers on both the House and Senate sides. Credit: Richard Allen/UC Berkeley |
|
Earthquake early warning overview presentation - April 2012 |
|
This 15 minute presentation gives an overview of what earthquake early warning is, how it is currently being used in Japan, the current status of development in the US, and finally possible applications of early warning. There are four videos included in the presentation. Credit: Richard Allen/UC Berkeley |
|
25 sec warning for San Francisco and Oakland - UserDisplay recording |
|
The M3.5 Aromas earthquake (April 13, 2012) occured just east of Santa Cruze not far from the epicenter of the 1989 Loma Prieta earthquake. ShakeAlert delivered an alert with an initial magnitude estimate of 3.2 climbing to 3.4 in 2 sec. The warning appeared in the UserDisplay (in Berkeley) with 25 sec of warning. Although this event did not generate any felt shaking in the Bay Area, it demonstrates the speed of the current ShakeAlert system. In a repeat of the Lama Prieta earthquake, ShakeAlert could provide ~20 sec of warning to San Francisco and Oakland. Credit: Richard Allen/UC Berkeley |
|
Earthquake early warning - UserDisplay demo - Loma Prieta |
|
Demonstration of how an earthquake alert can be received and displayed on a computer. This video shows the ShakeAlert UserDisplay for a scenario earthquake in northern California: a repeat of the Loma Prieta earthquake. This window would pop-up on your computer desktop and count down until the shaking is felt at your location. The user location is shown by the house, set to San Francisco in this video. The estimated intensity of shaking (moderate in this case) and the countdown are specific to the user location. Credit: Richard Allen/UC Berkeley |
|
Earthquake early warning overview presentation - fall 2011 |
|
This 15 minute presentation gives an overview of what earthquake early warning is, how it is currently being used in Japan, the current status of development in the US, and finally possible applications of early warning. There are four videos included in the presentation. The video files have to be downloaded from the links that are provided on the slides with the videos.
|
Seismograms | ||
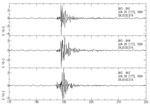 Credit: Richard Allen/UC Berkeley JPEG image PDF file |
The Berkeley Earthquake | |
Earthquake animation: M8.0 on the San Andreas Fault | ||
Right-Click to download the movie as a 321Mb AVI file |
This animation shows a magnitude 8.0 earthquake on the San Andreas Fault. This earthquake is about the same magnitude as the 1906 event and runs in realtime. As the rupture propagates from the north to the south, radiating P-wave energy is represented as red circles and S-wave energy as yellow. The total rupture takes 2 to 3 minutes to complete, and it is not until the rupture reaches the San Francisco Bay Area that most of the damage occurs in the Bay Area. | |
Earthquake early warning | ||
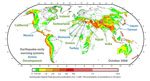 Credit: Richard Allen JPG image PDF file Active and developing earthquakes early warning systems around the world superimposed on a map of seismic hazard. |
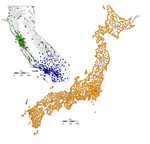 Credit: Richard Allen JPG image PDF file Comparison of the seismic stations in Japan used for earthquake early warning to those in California that could be used for earthquakes early warning. The maps are shown at the same scale. |
Seismic stations in California and Japan |
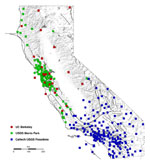 Credit: Richard Allen JPG image PDF file Seismic stations in California that could potentially be used for earthquakes early warning. |
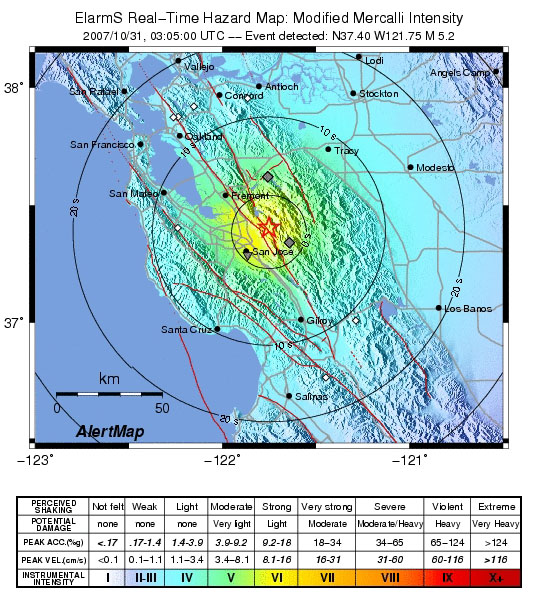
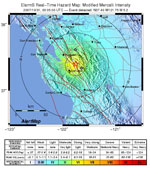 Credit: Richard Allen JPG image Alum Rock AlertMap |
Alum Rock AlertMap (left) |
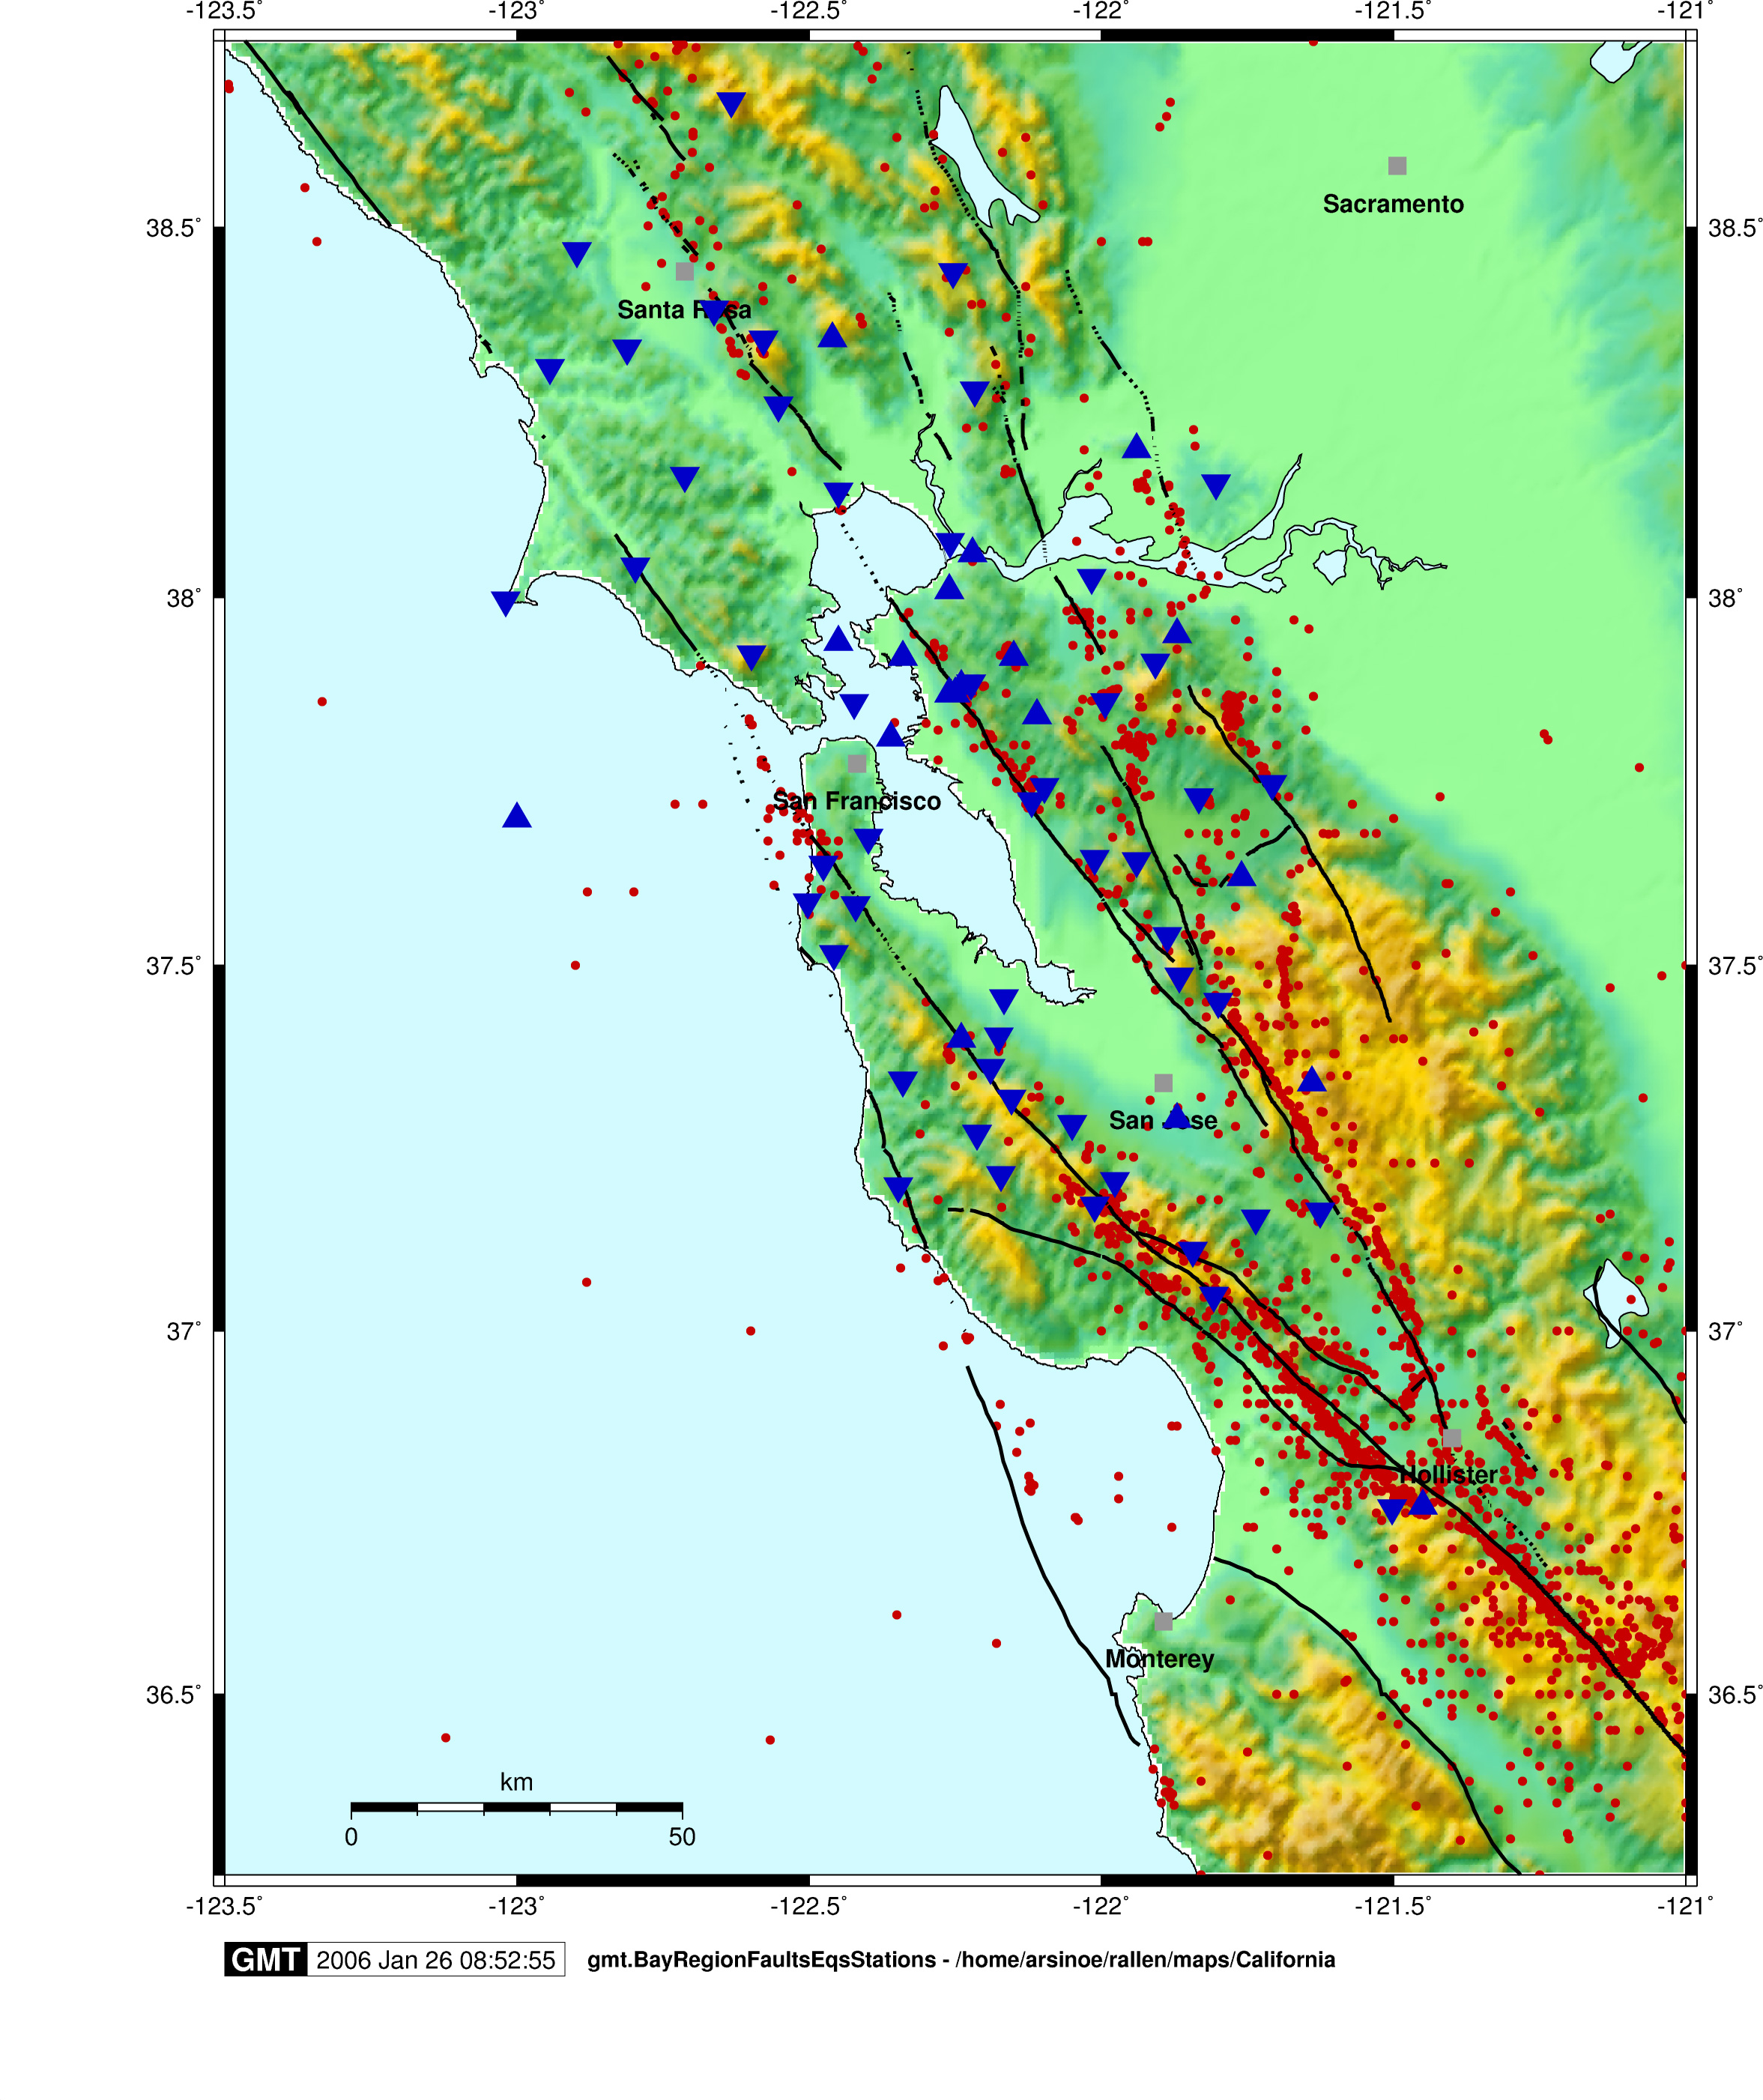
Earthquakes, faults and seismic station maps | ||
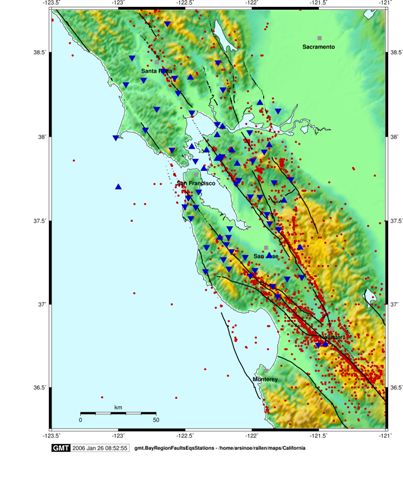 Bay Area earthquakes: red; faults: black lines; seismic stations: blue view small image view large image (1.5Mb JPG) view large image (5.6 Mb pdf) Credit: Richard Allen | 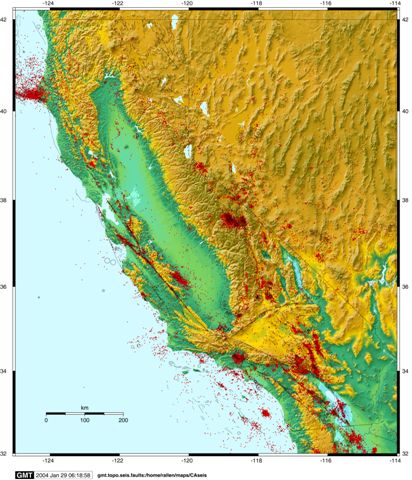 California and Nevada earthquakes: red dots and black circles (mag > 5); faults: black lines view small image view large image (3.4Mb JPG) view large image (12.2 Mb pdf) Credit: Richard Allen |
|
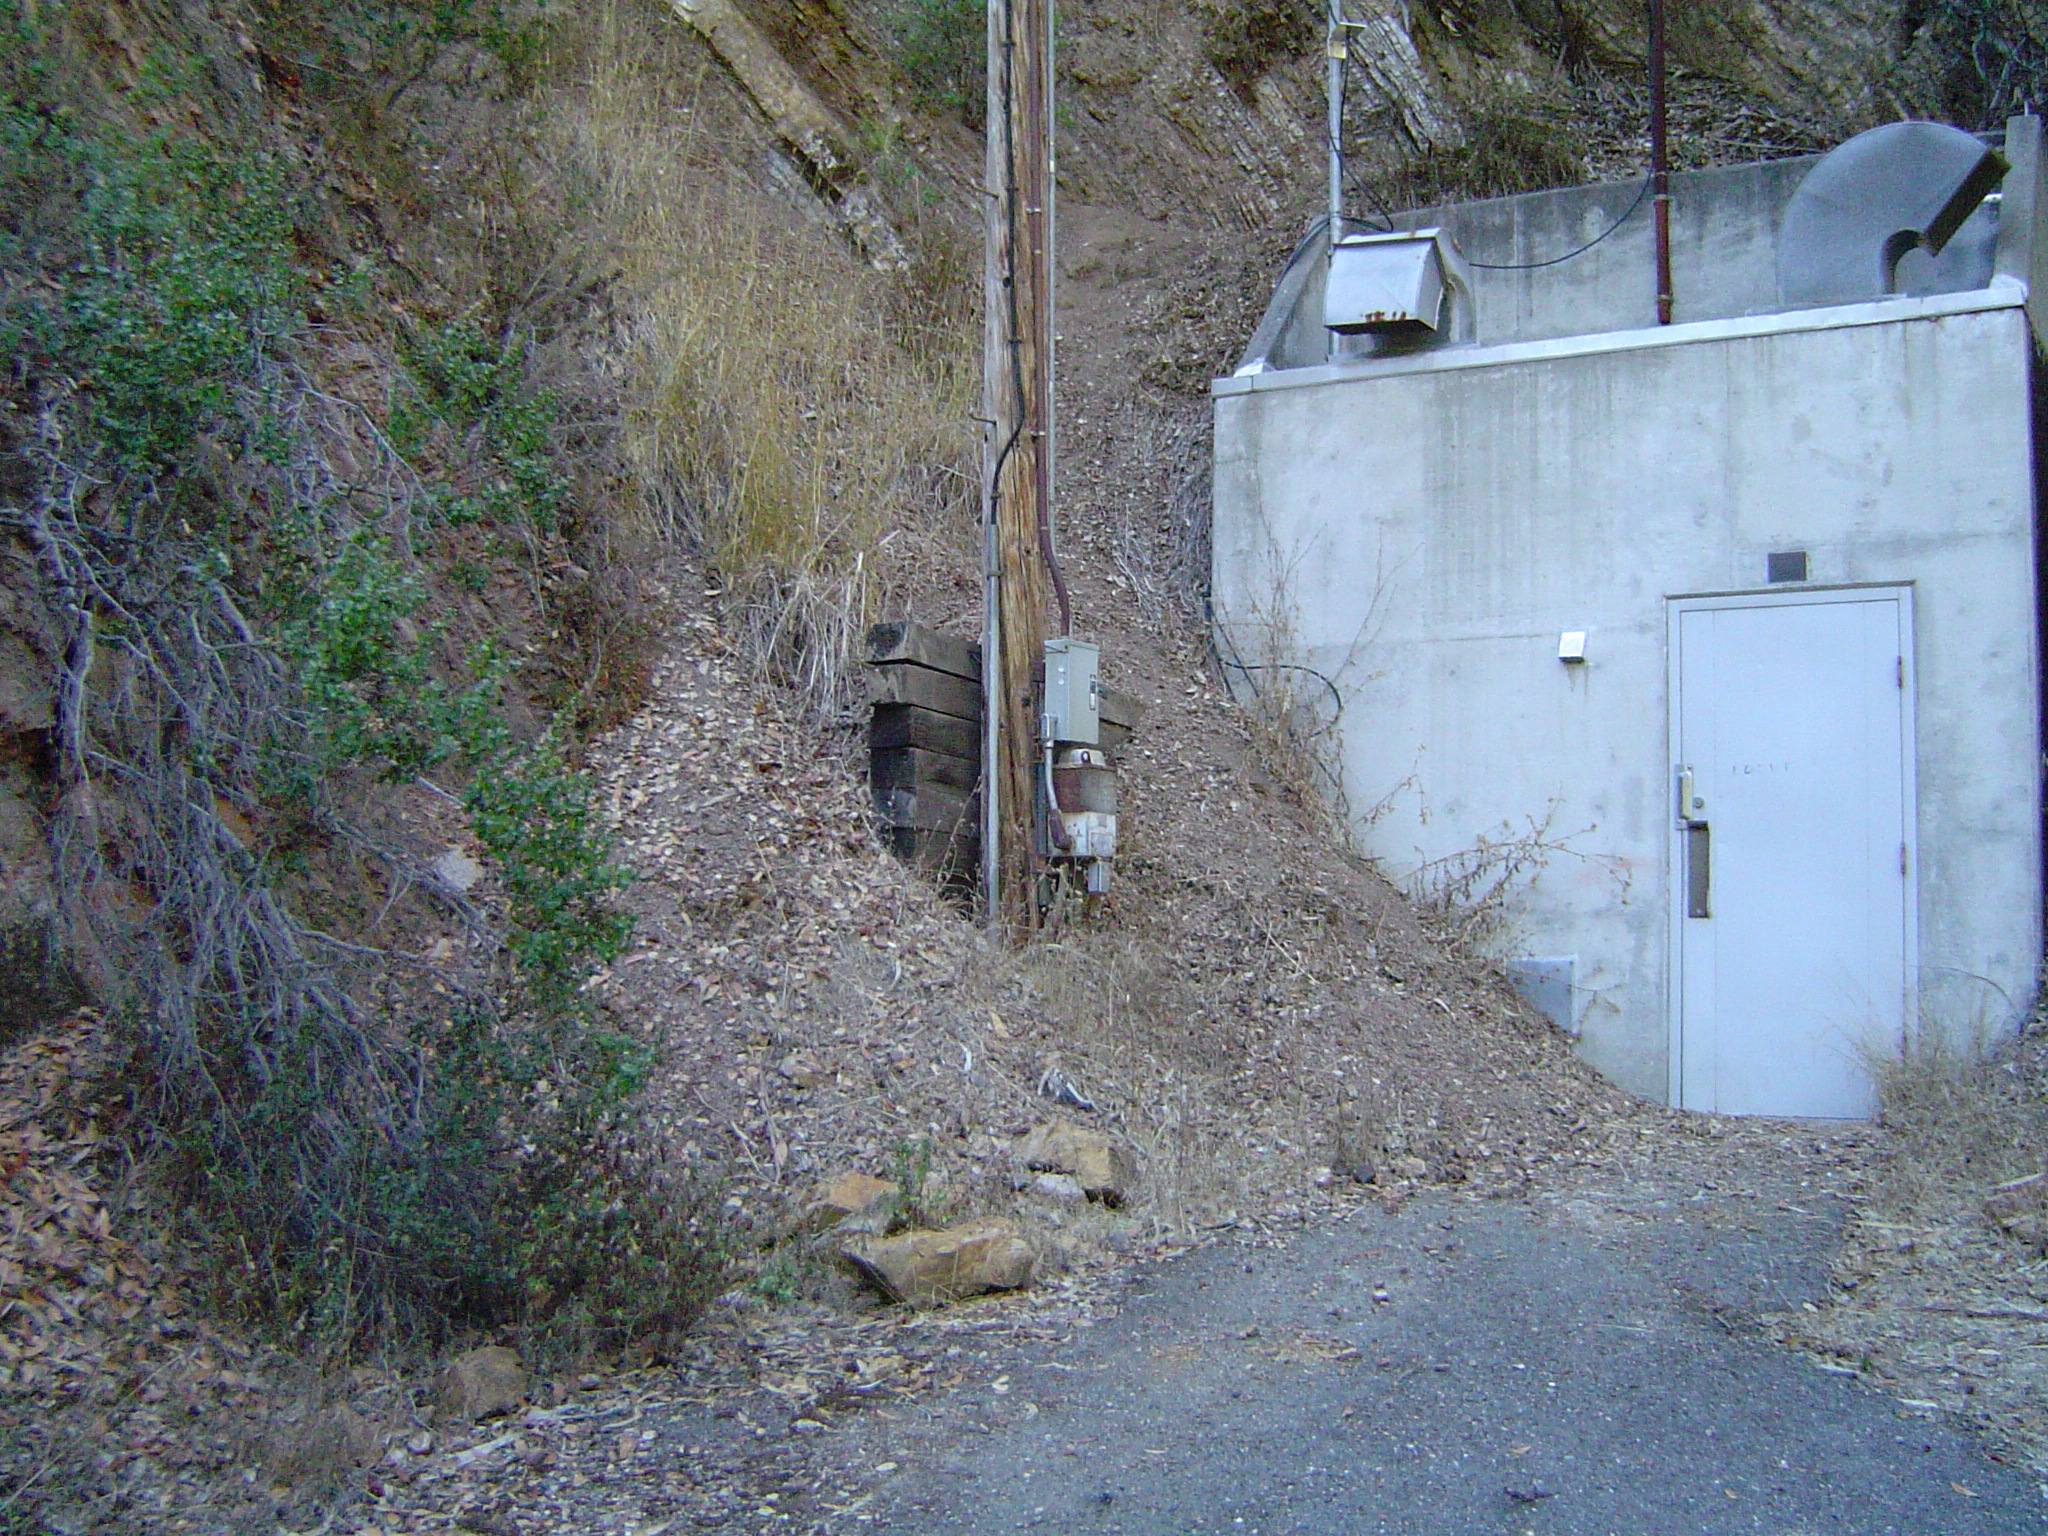
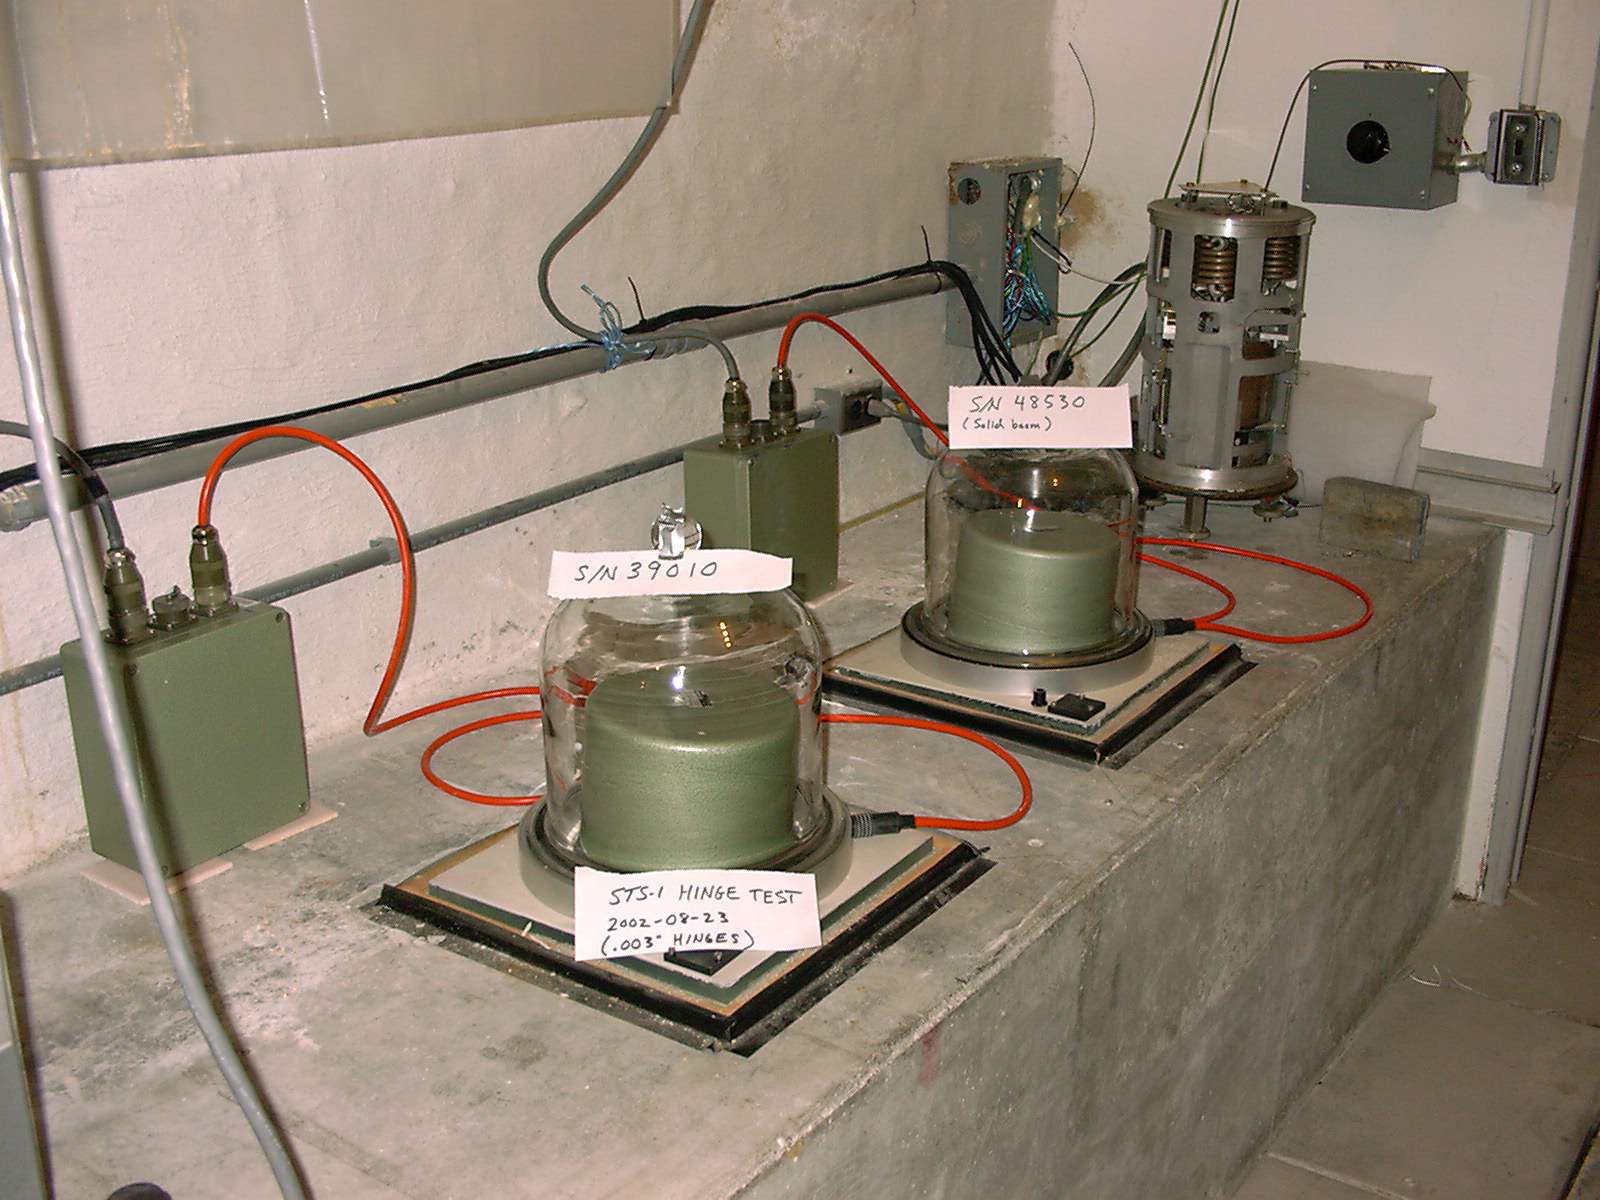
Seismic station/seismometers - Byerly vault In Strawberry Canyon above the UC Berkeley campus and home to the Berkeley Digital Seismic Network Station BKS. | ||
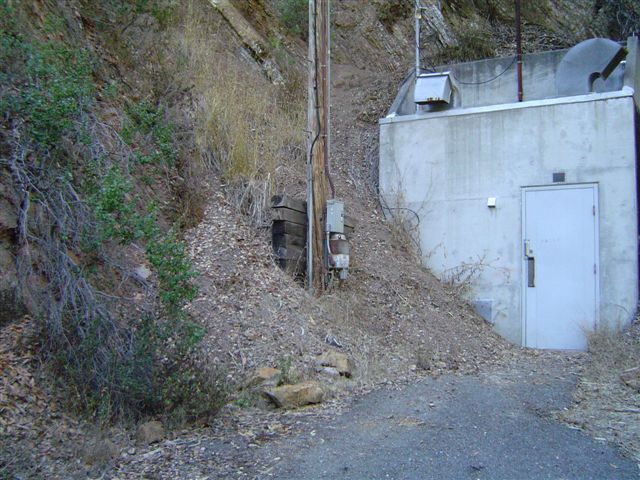 Entrance to the Byerly vault view small image view large image | 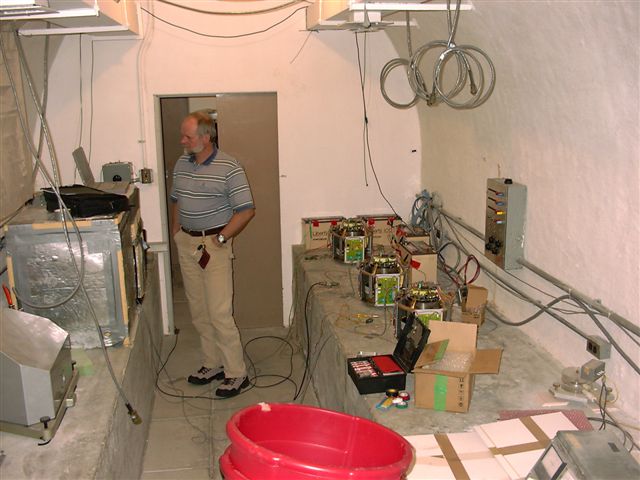 The pier inside the vault view small image view large image | 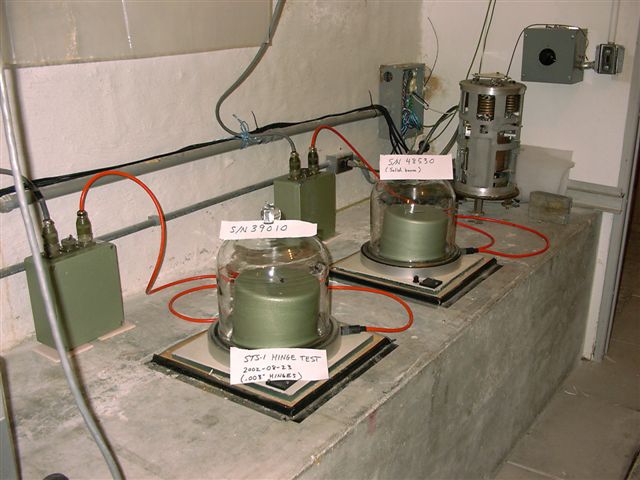 STS-1 seismometers on the pier view small image view large image |
Seismic station/seismometers - PASSCAL deployments Seismic stations deployed in various regions. These are "temporary" stations meaning that they are deployed for 2-4 years as part of regional seismic network. | ||
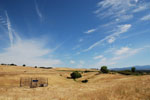 Credit: Richard Allen JPG image One of 84 seismic stations installed in northern California in 2007 as part of the Mendocino Experiment. |
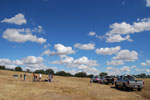 Credit: Richard Allen JPG image The installtion team as work installing one of 84 seismic stations in northern California in 2007 as part of the Mendocino Experiment. | |
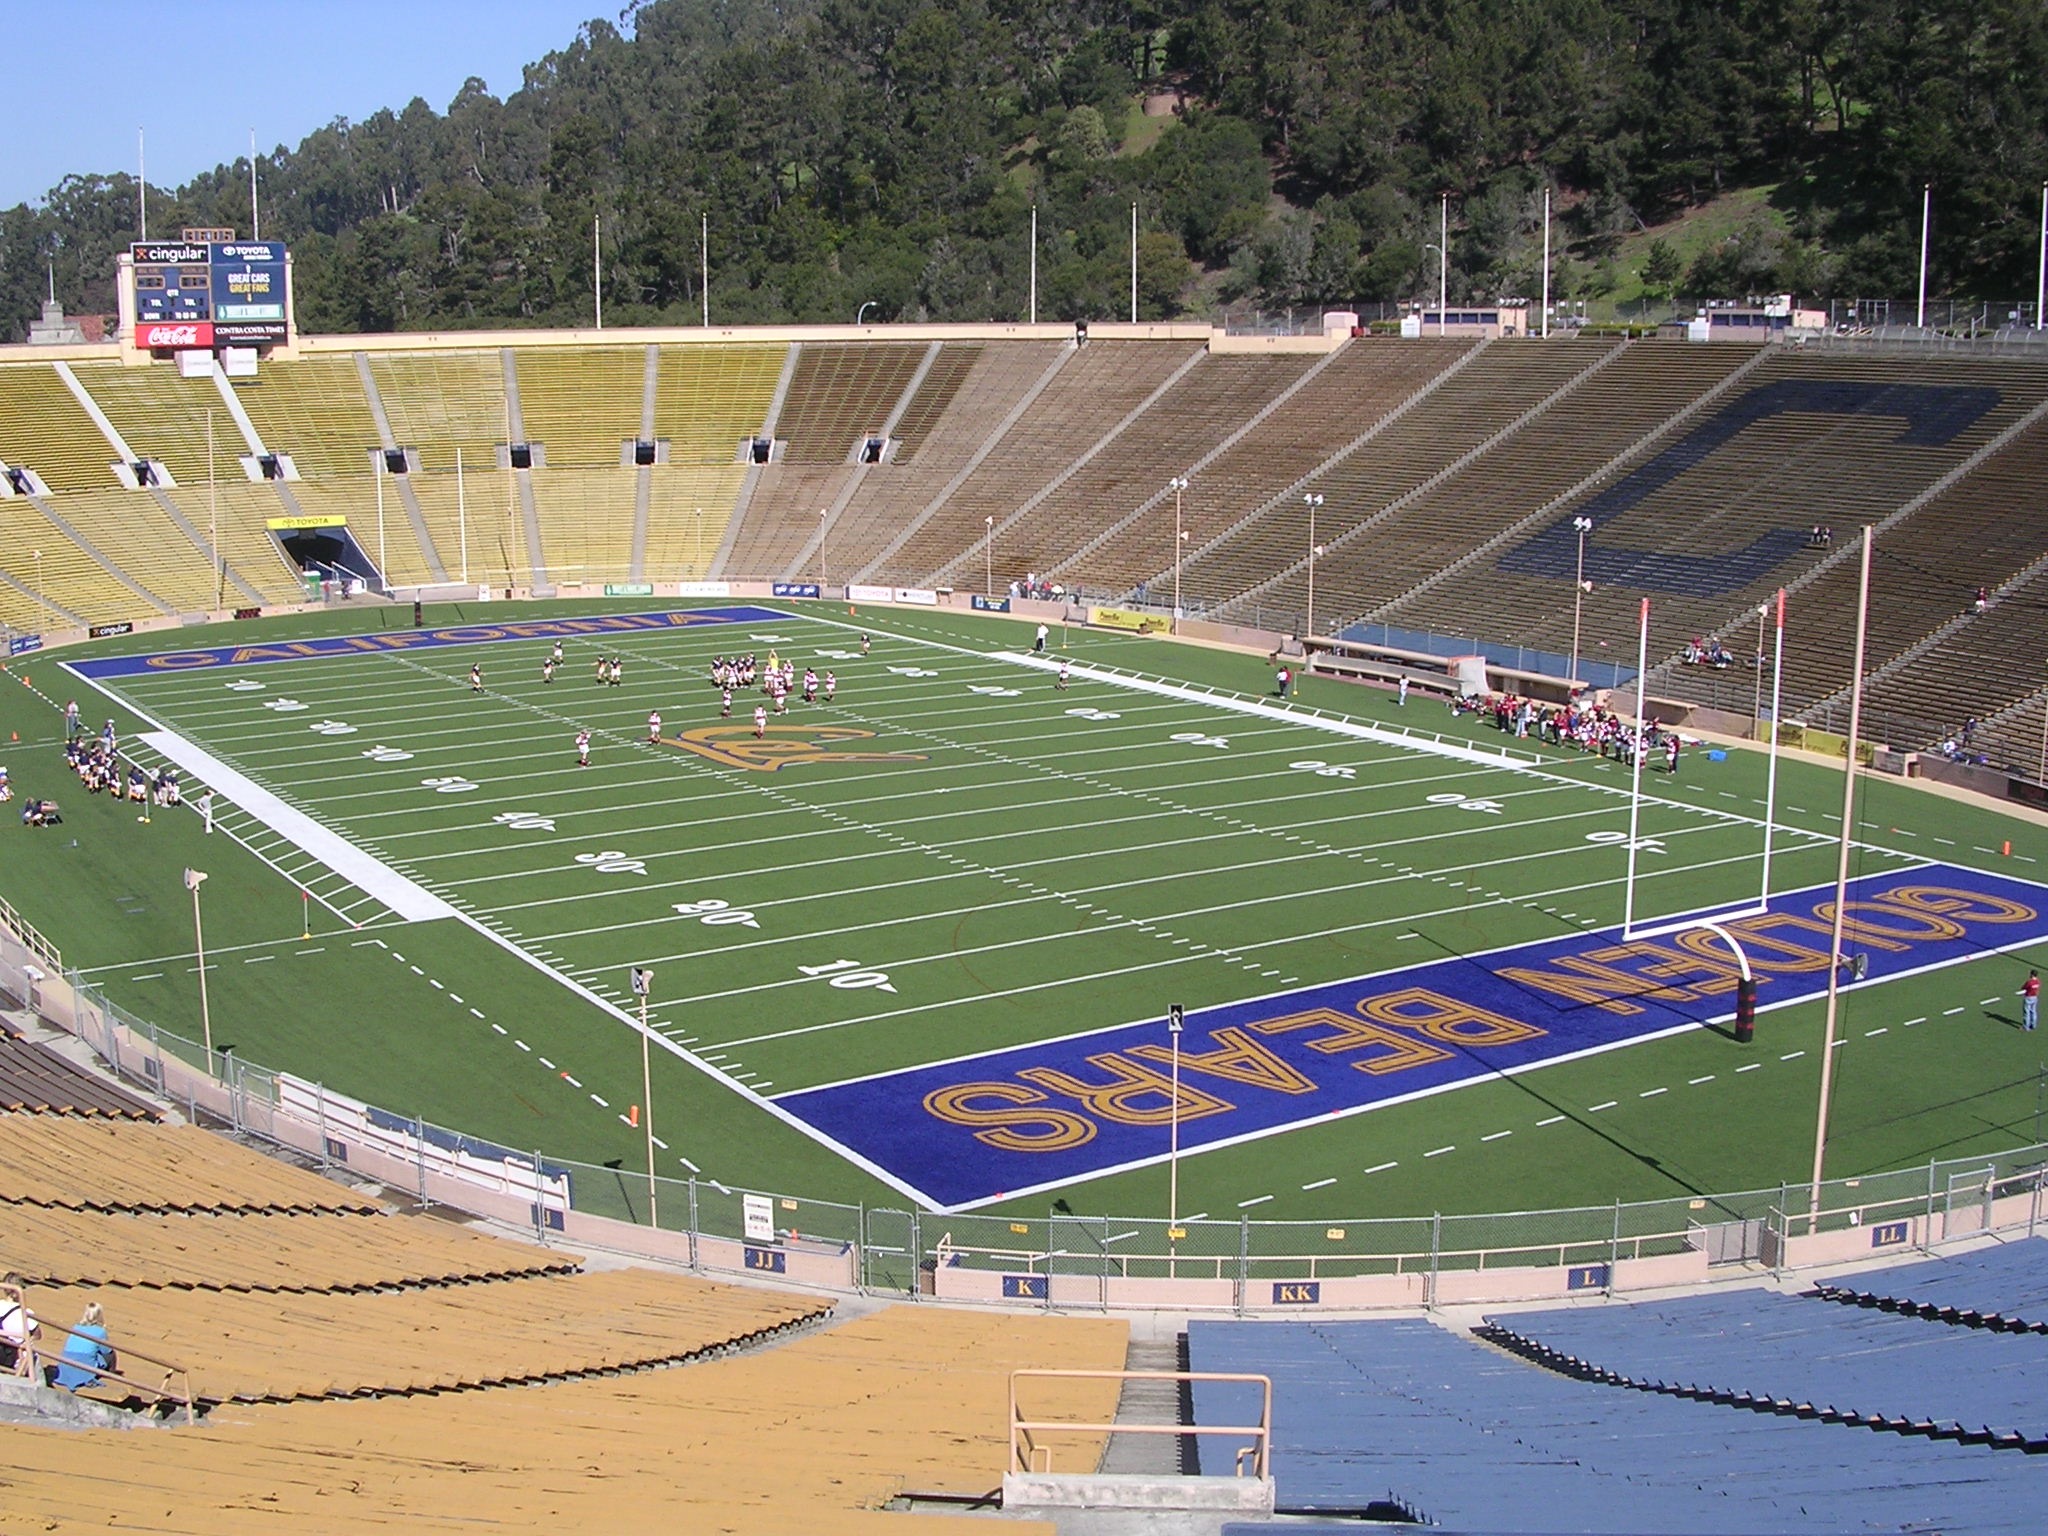
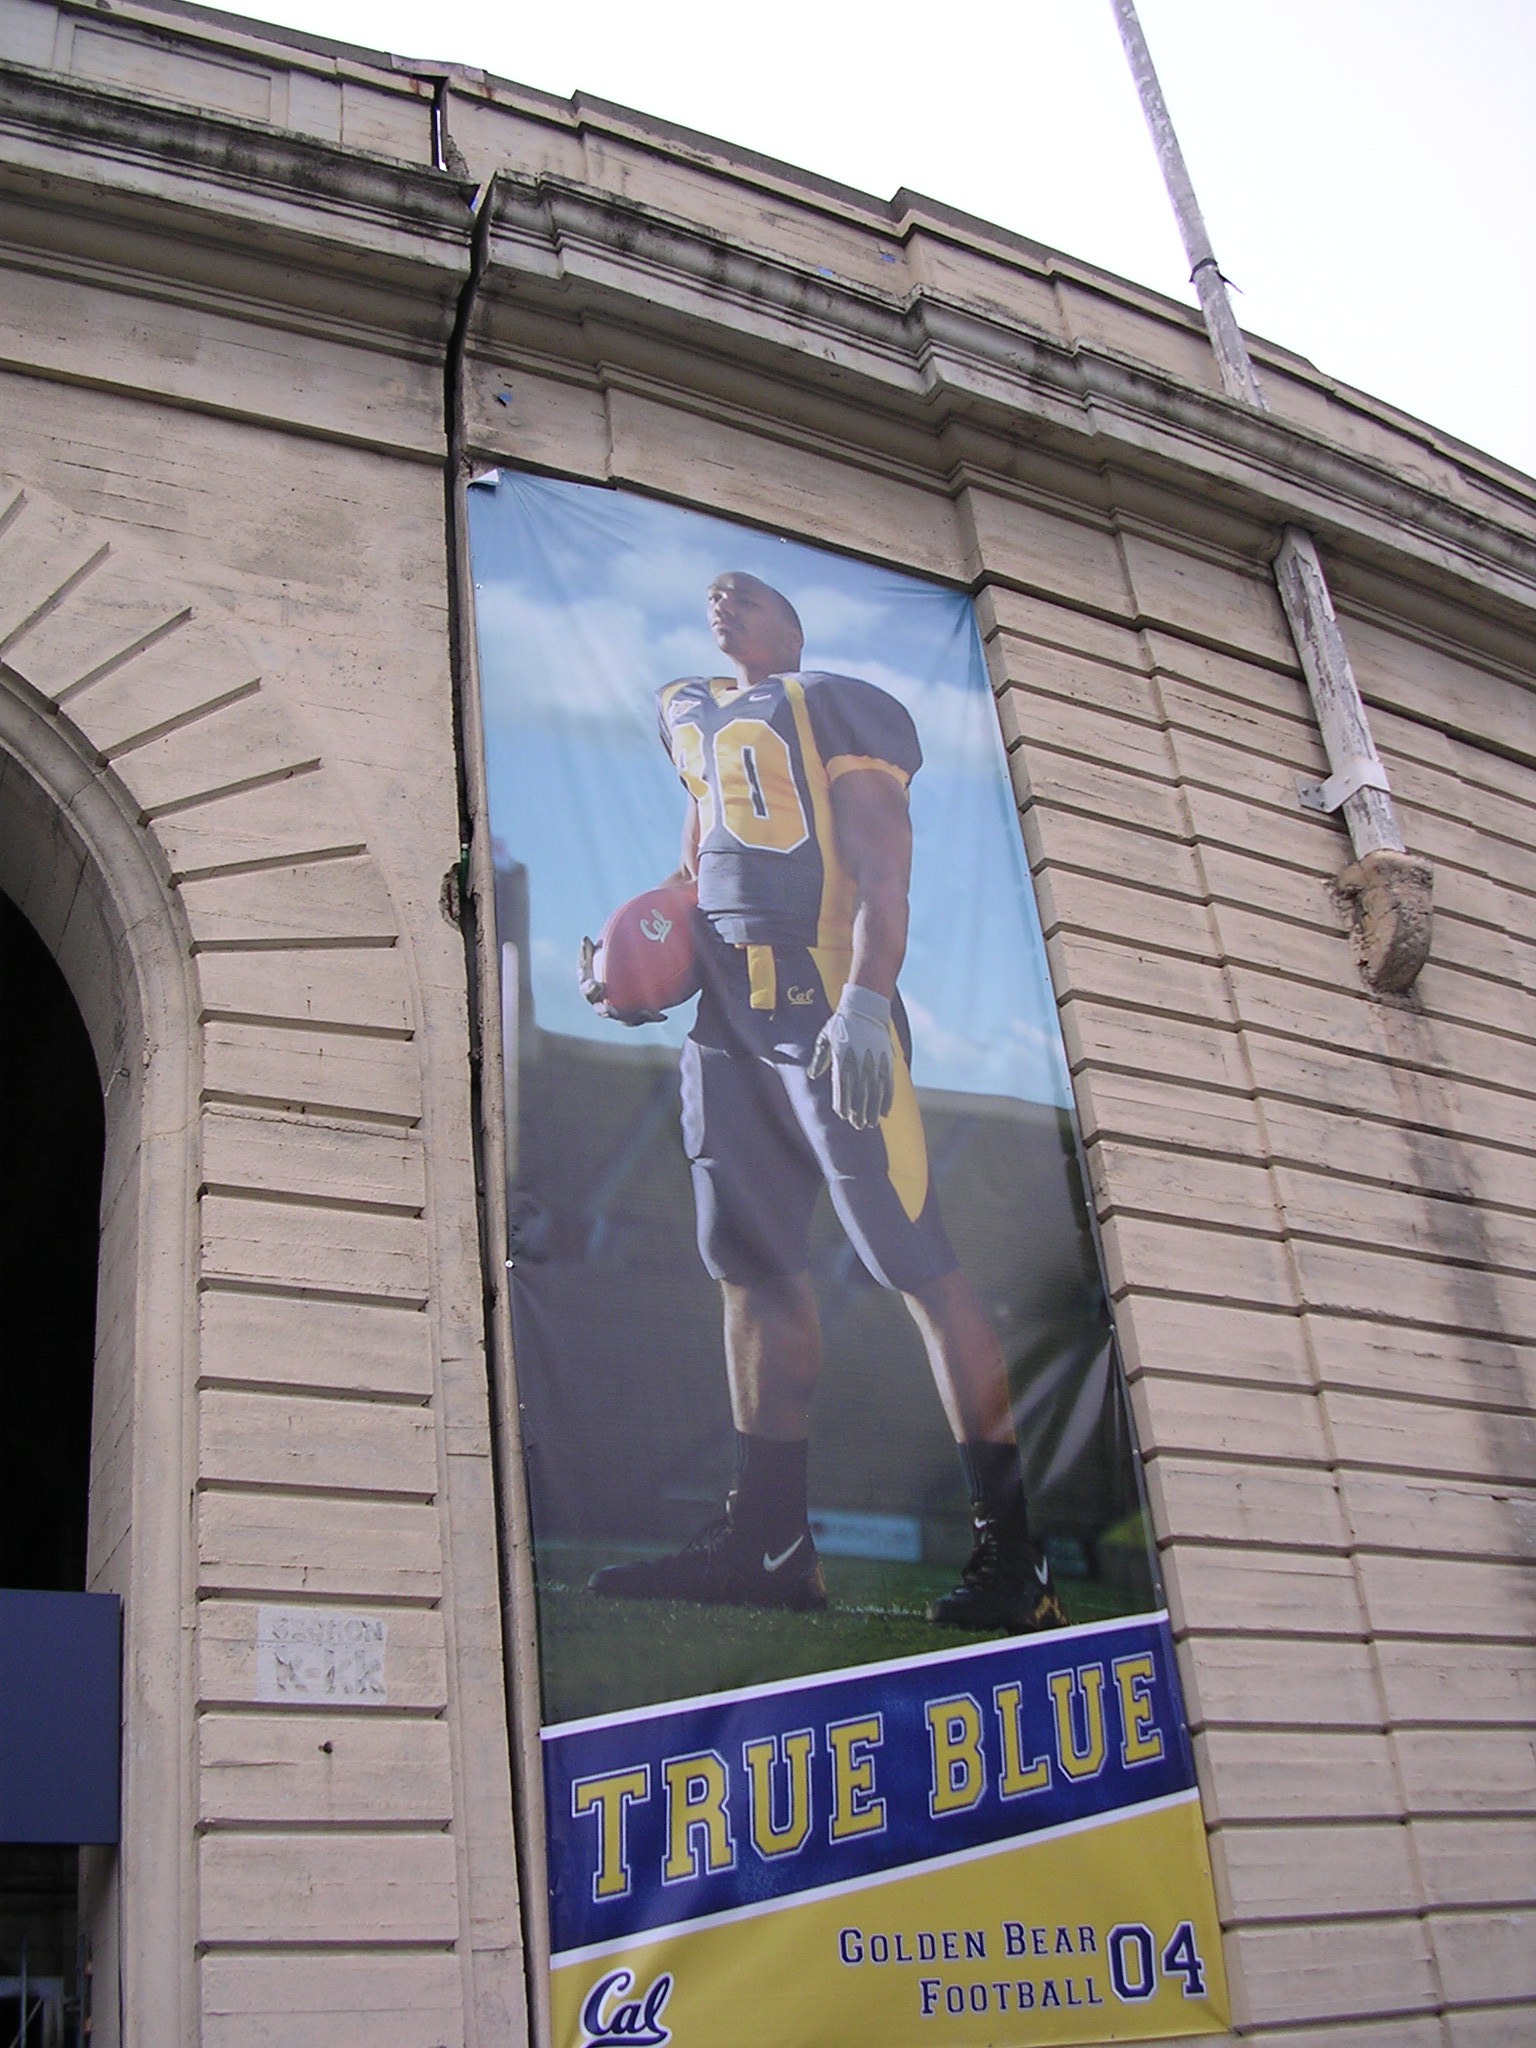
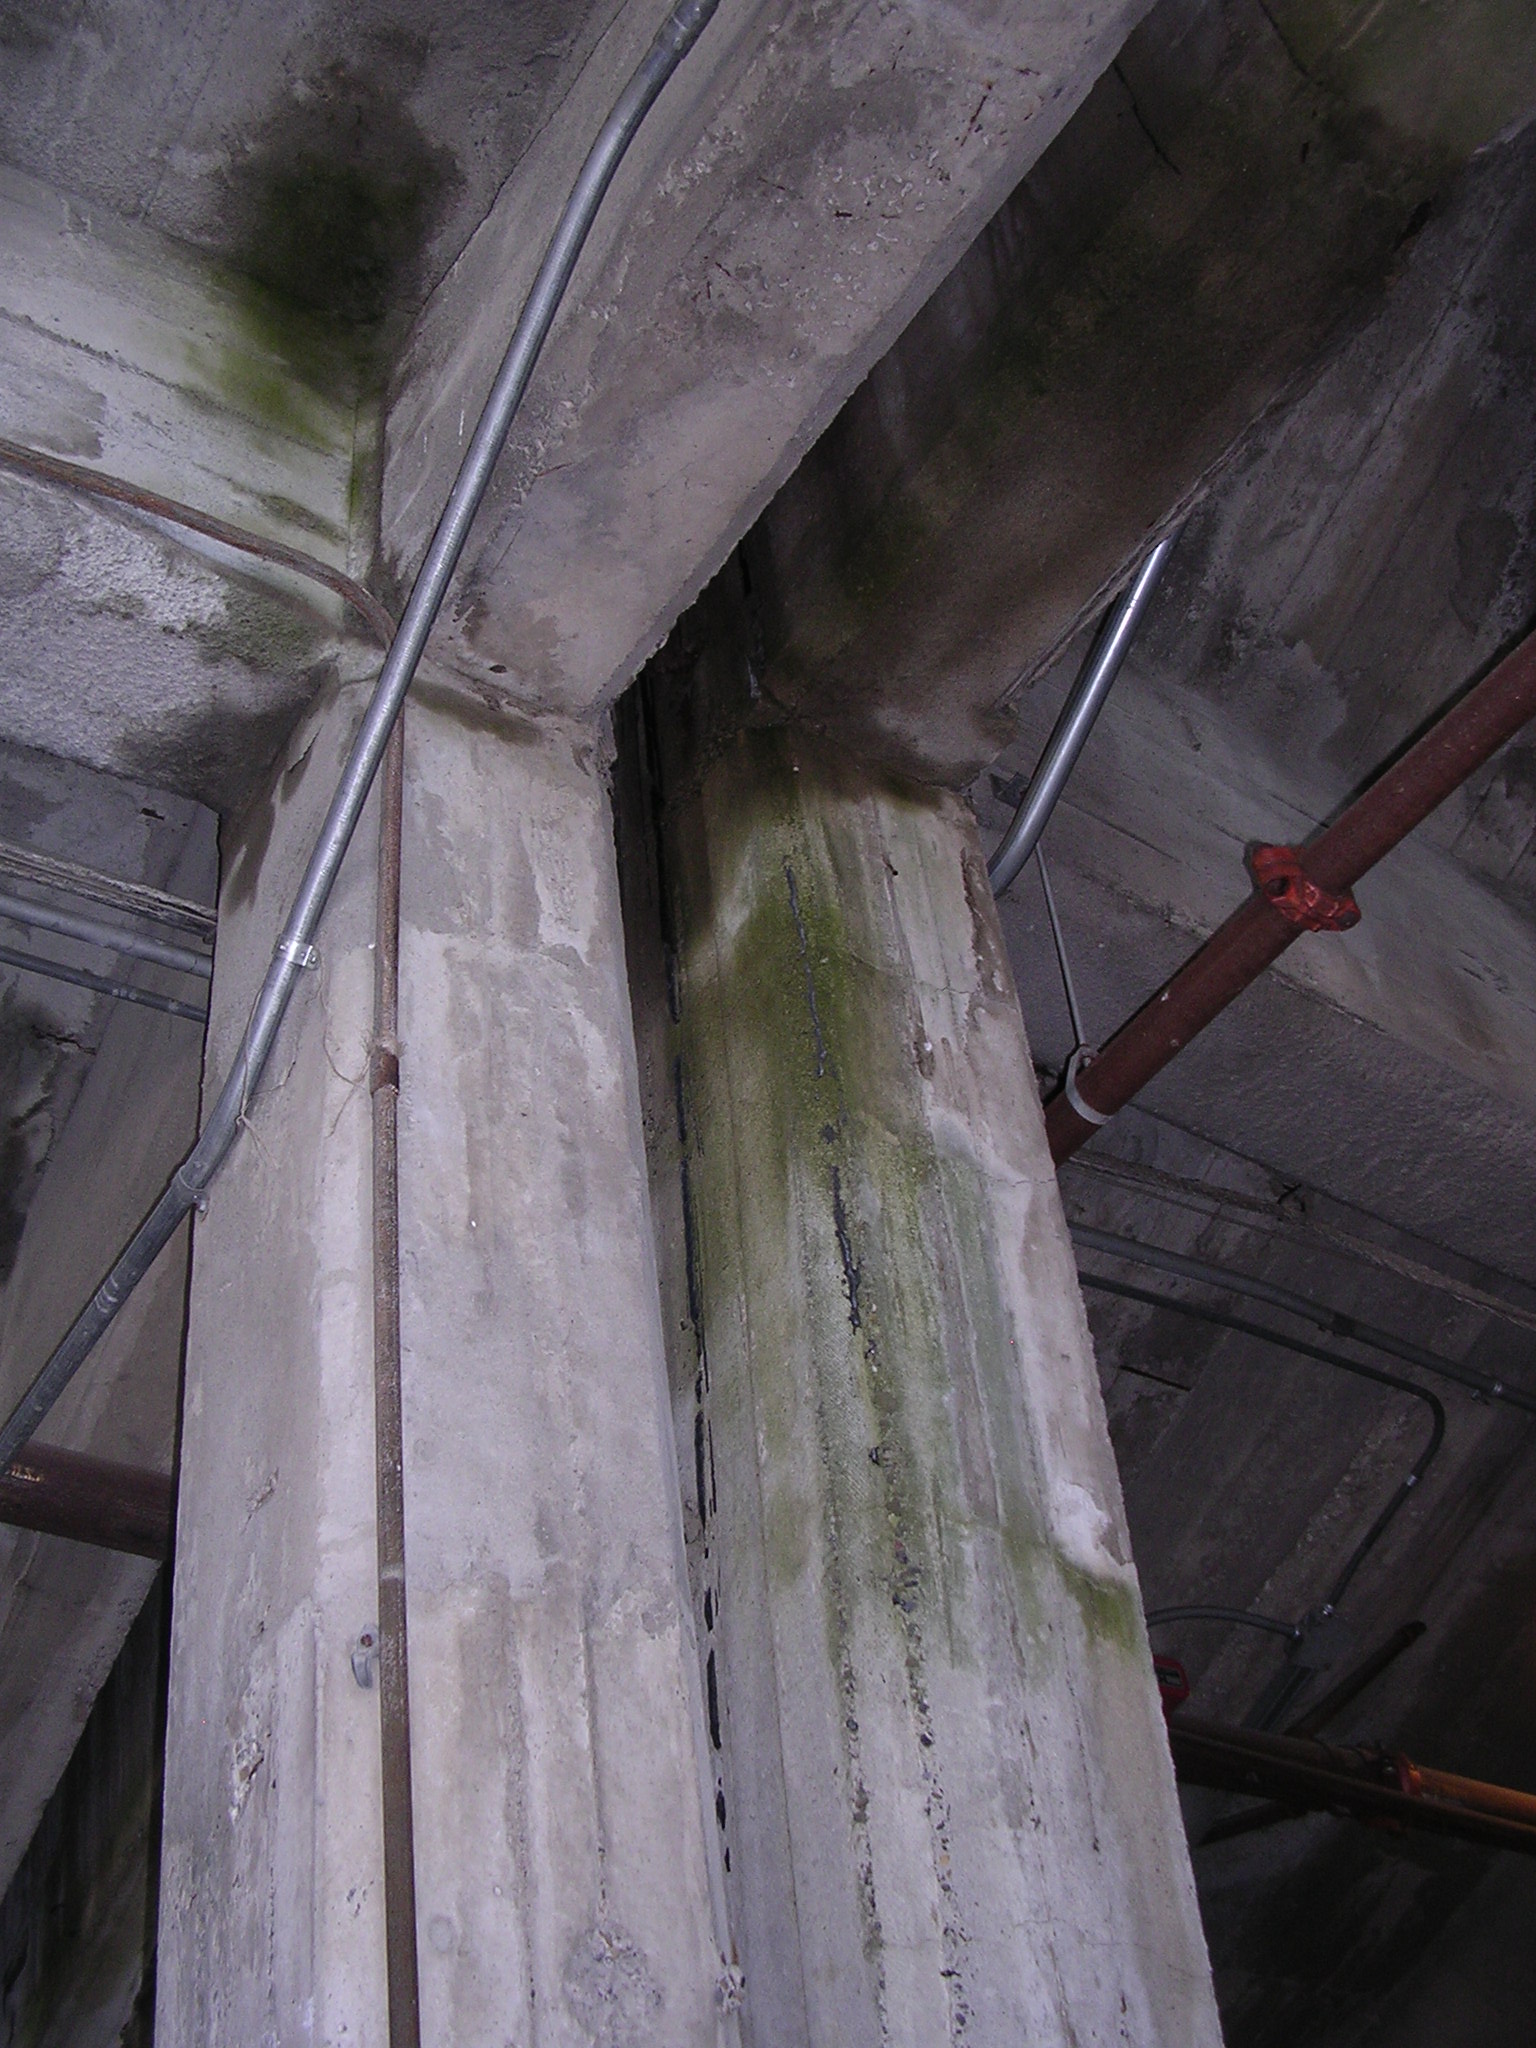
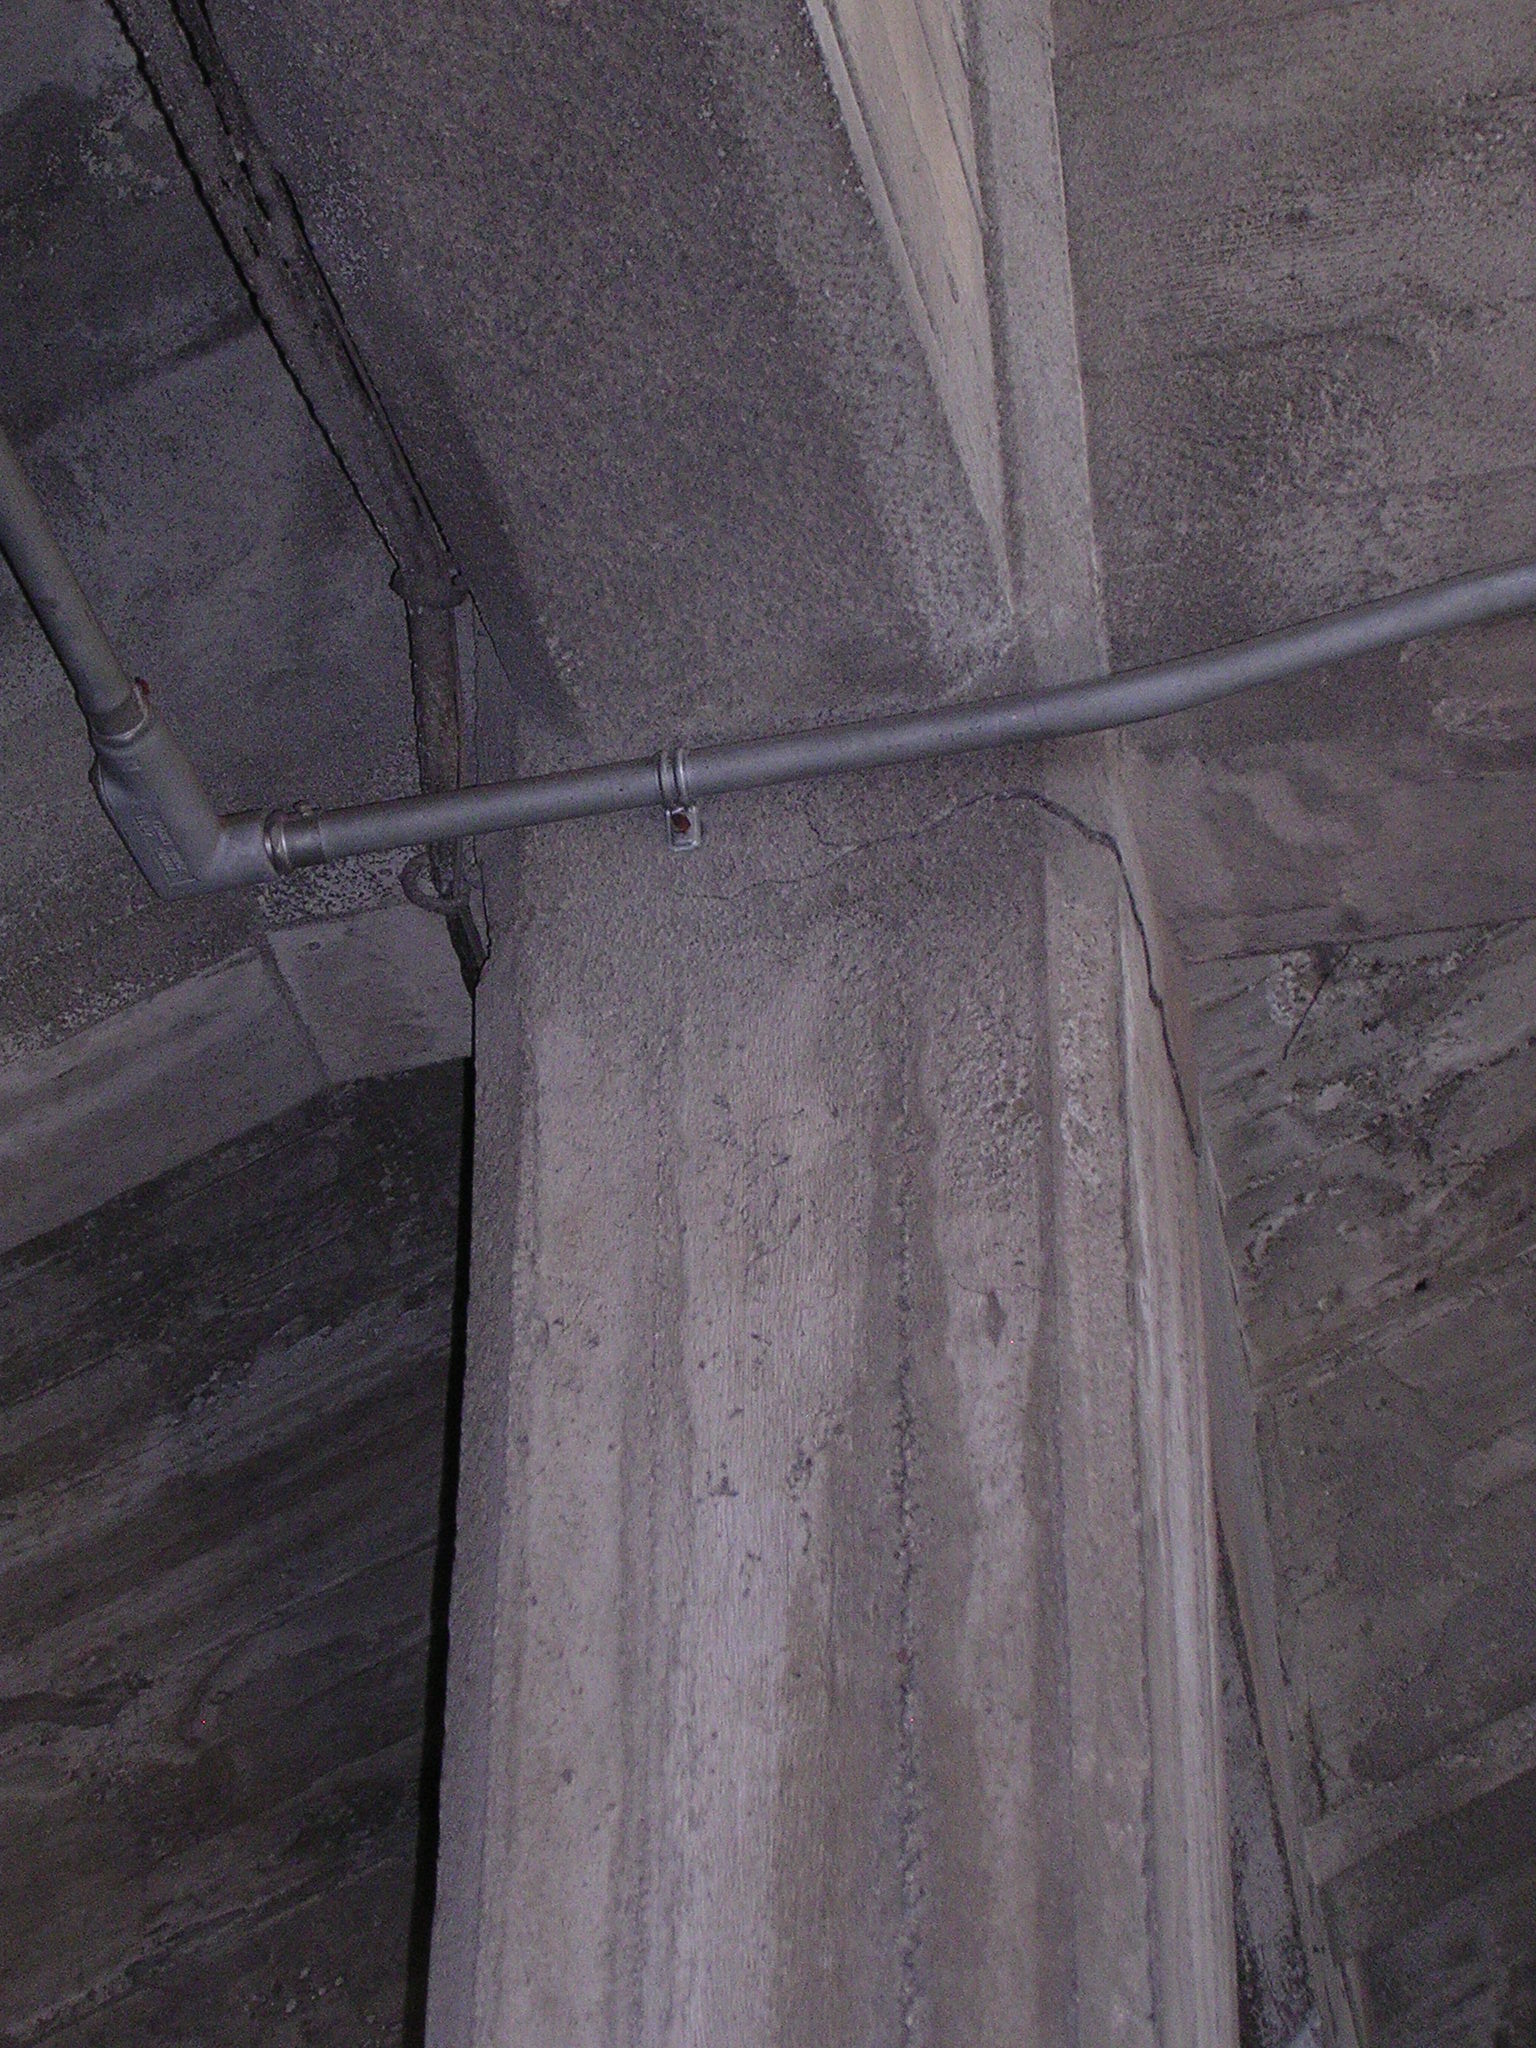
Memorial Stadium Built in 1923, the stadium straddles the Hayward Fault which runs goalpost to goalpost. Continuous creep on the fault has caused the building to deform over time. | ||
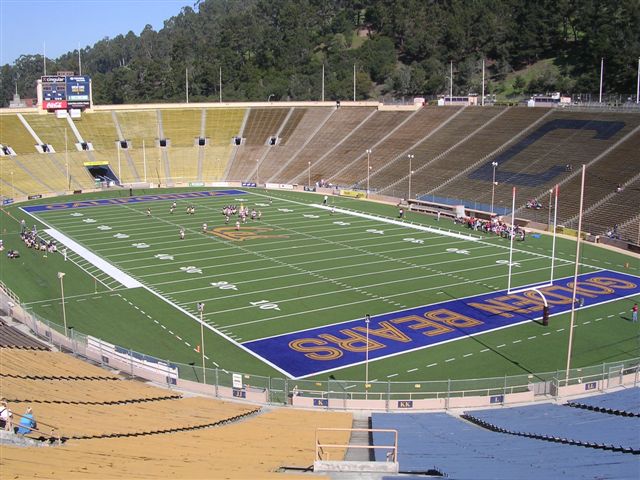 Memorial Stadium view small image view large image Credit: Richard Allen |  Exterior expansion joint in section KK view small image view large image Credit: Richard Allen | 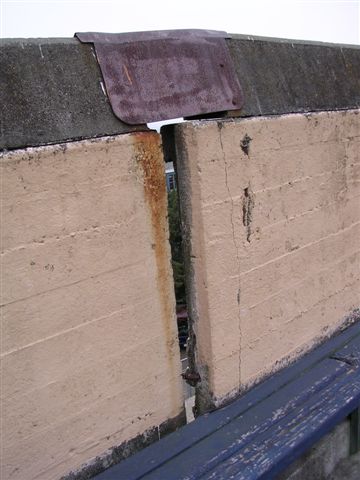 Expansion joint in section KK view small image view large image Credit: Richard Allen |
 The columns on either side of the expansion joint are offset by the creep view small image view large image Credit: Richard Allen | 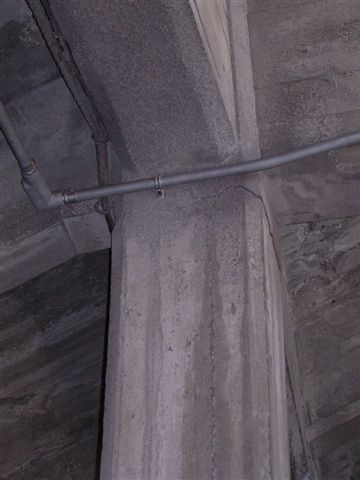 This offset causes cracks in the columns view small image view large image Credit: Richard Allen | 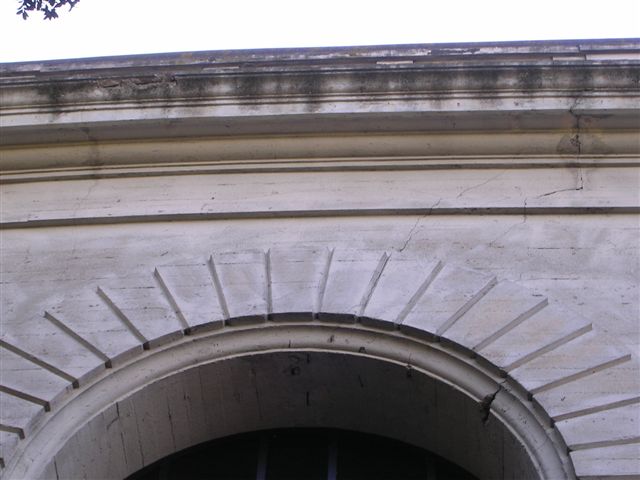 Diagonal cracks are also a result of the deformation view small image view large image Credit: Richard Allen |
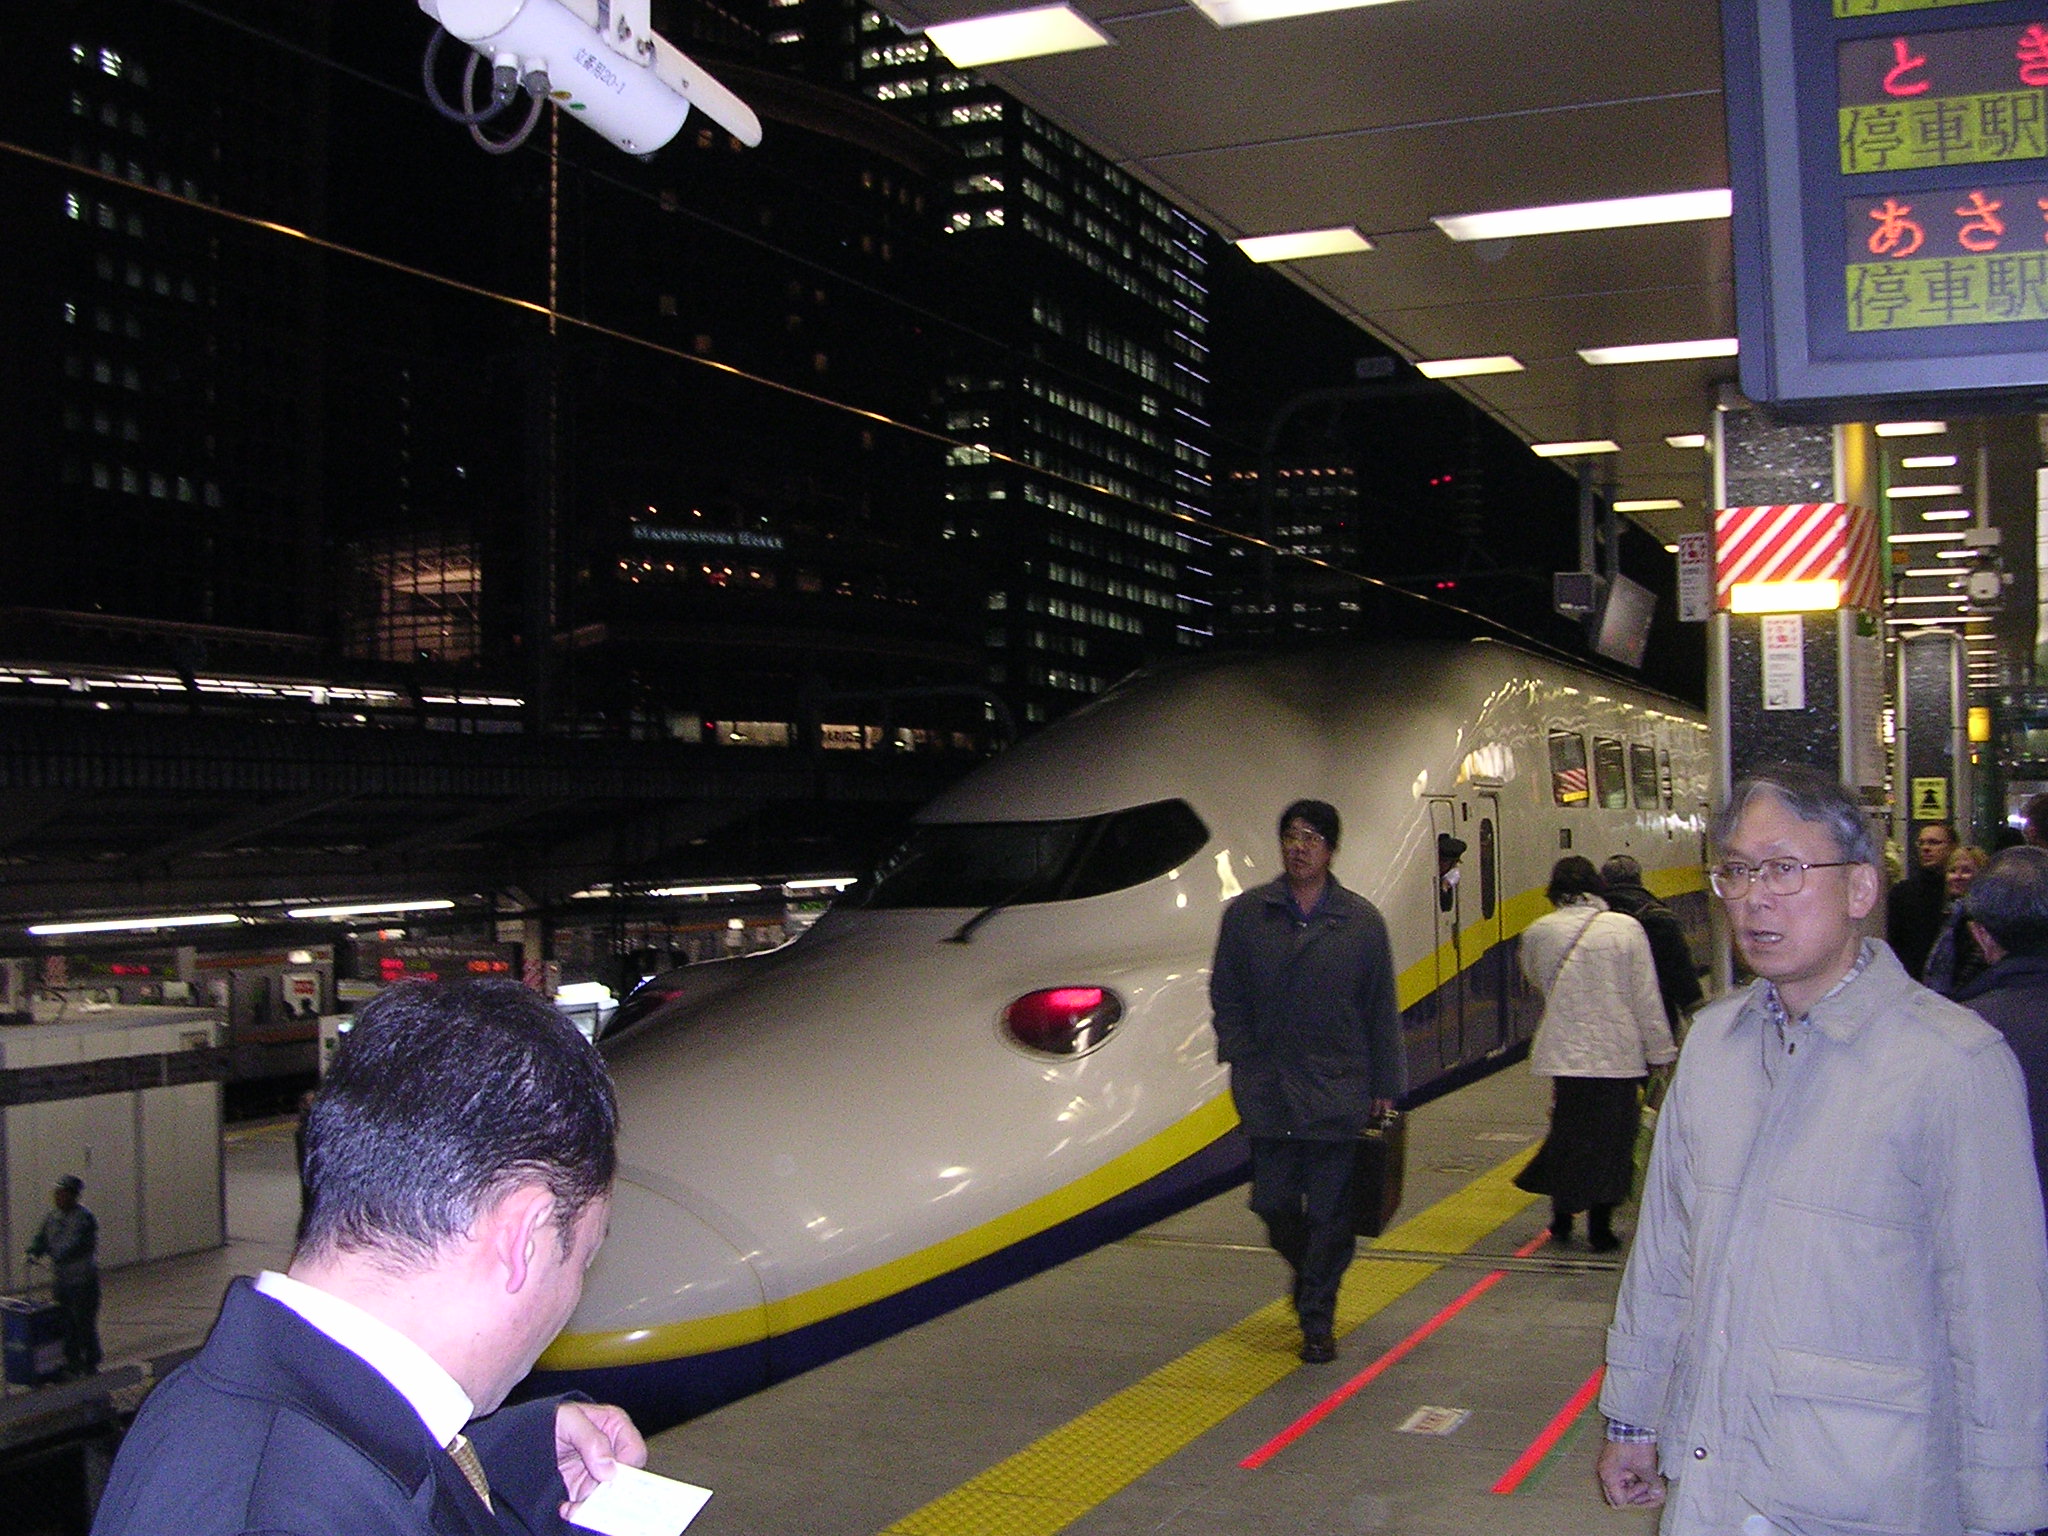
Japan | ||
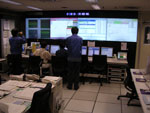 Credit: Richard Allen JPG image The control room at the Japanese Meterological Agency for the earthquake early warning system. |
 Credit: Richard Allen JPG image The Bullet Trains were one of the first users of earthquakes early warning in Japan. | |
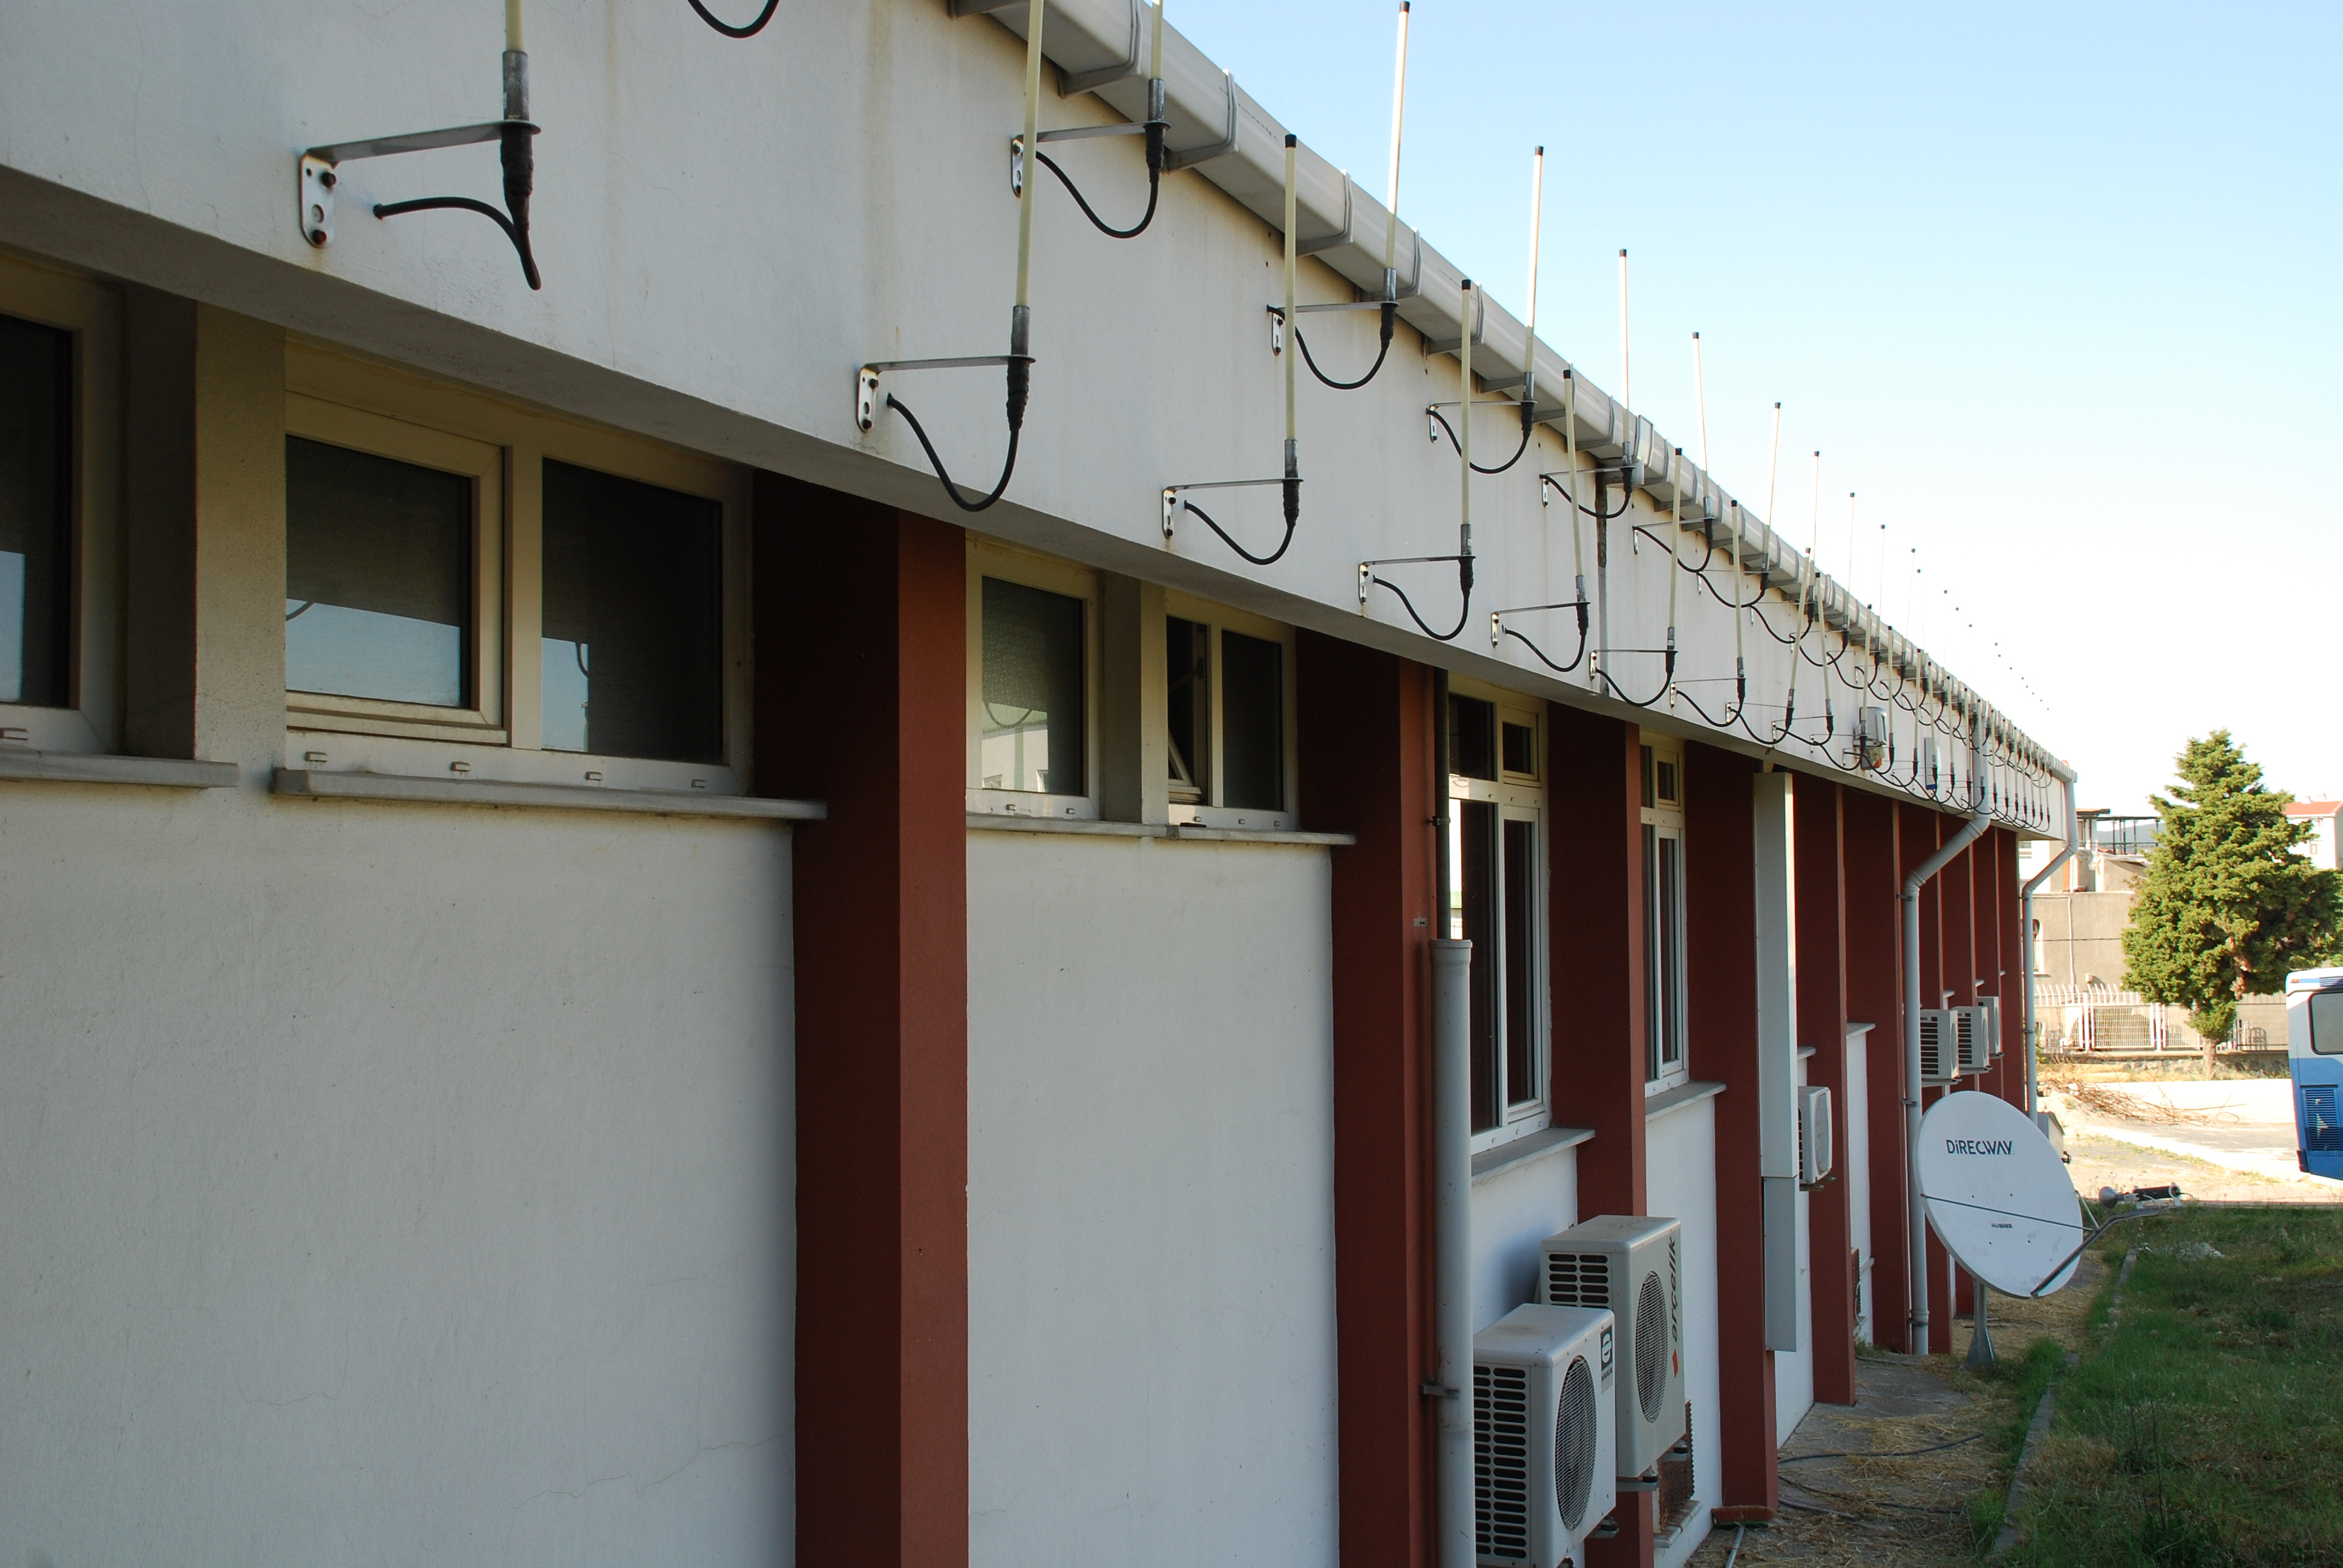
Turkey | ||
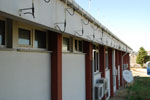 Credit: Richard Allen JPG image The antennas on the roof of the Kandilli Observatory and Earthquake Research Institute of Bogazici University in Istanbul. These receive the seismic data from the stations across the city used for earthquke early warning. | ||