| Electronic Supplement |
|
Probabilistic warning times Richard M Allen, UC Berkeley. Seismo. Res. Lett. 77 (3), 371-376, 2006. | reprint electronic supplement |
|
|
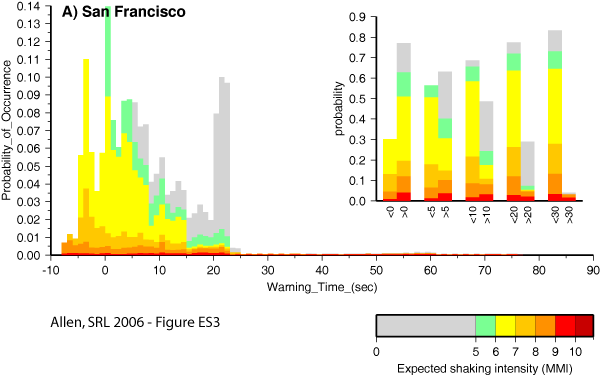
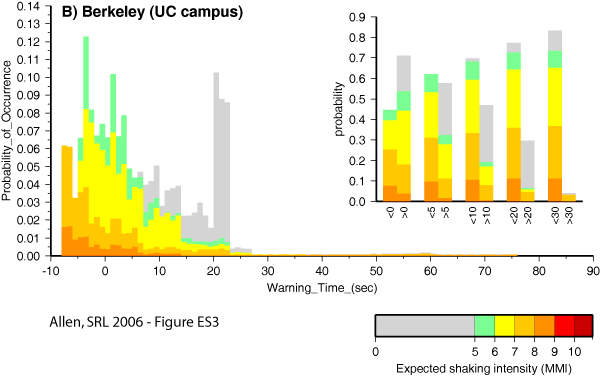
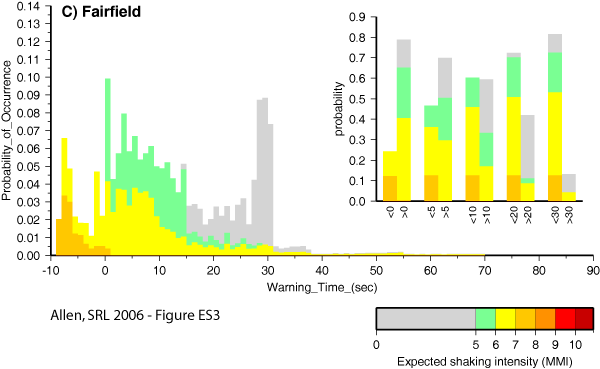
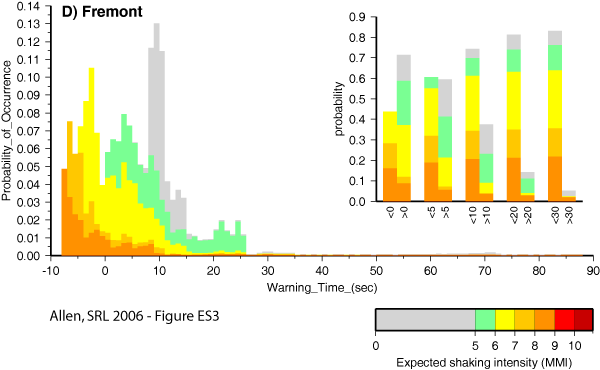
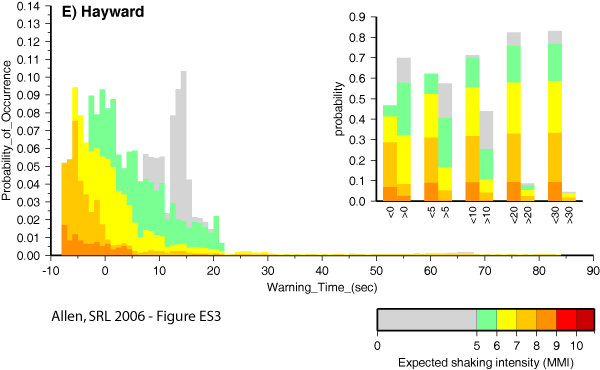
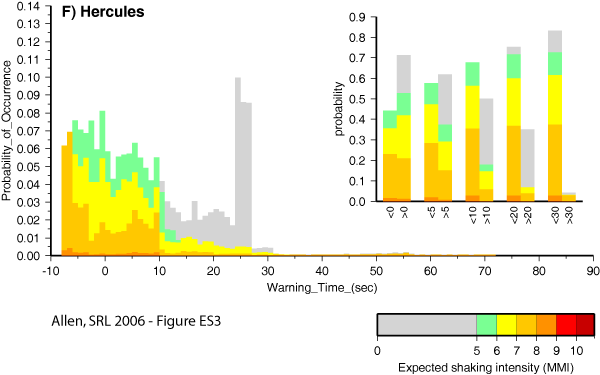
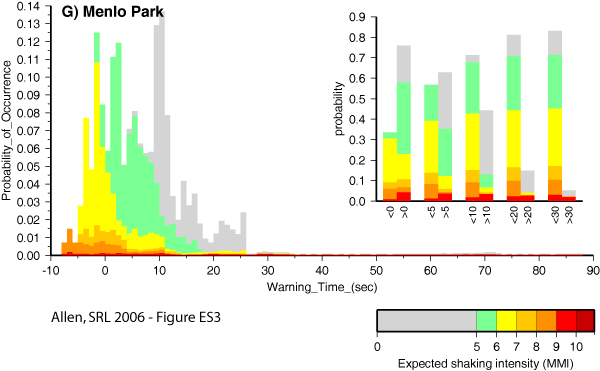
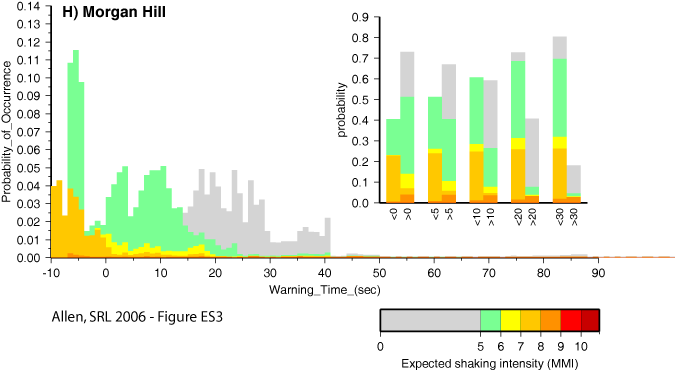
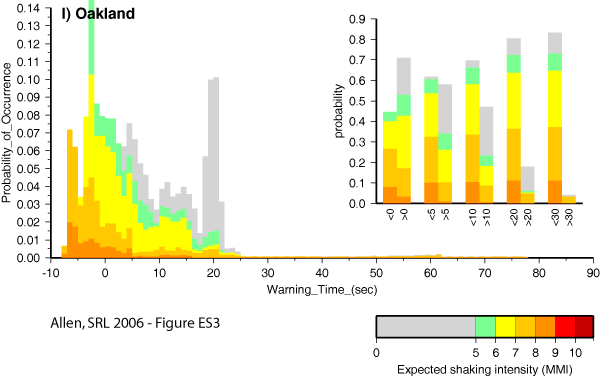
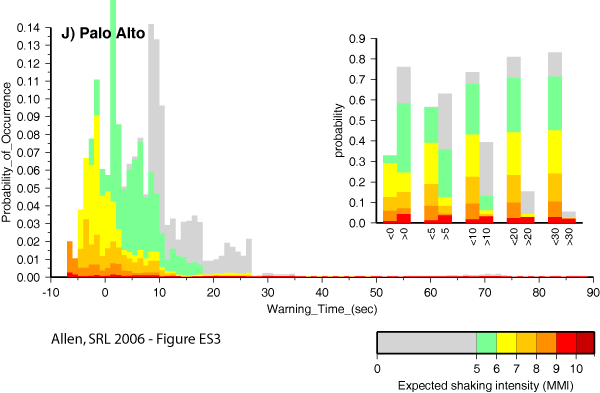
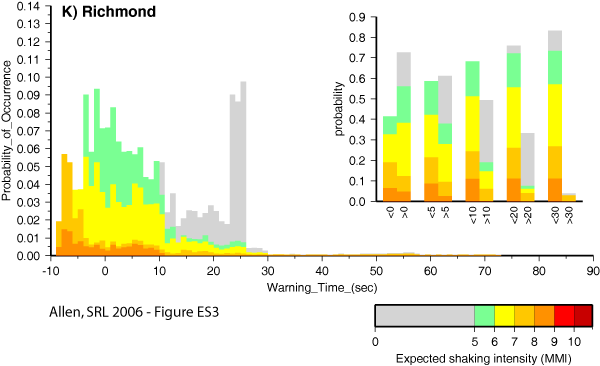
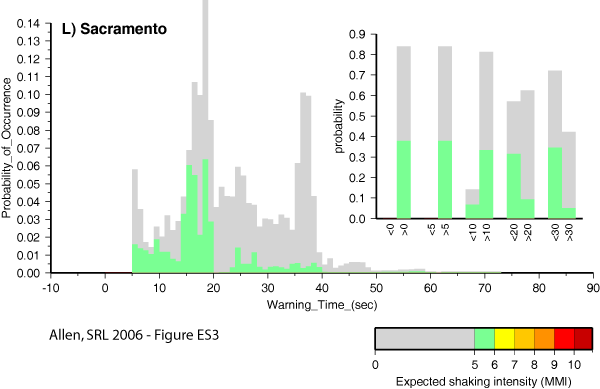
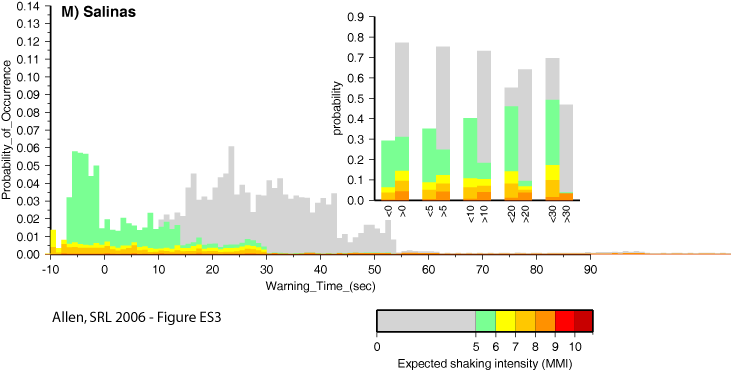
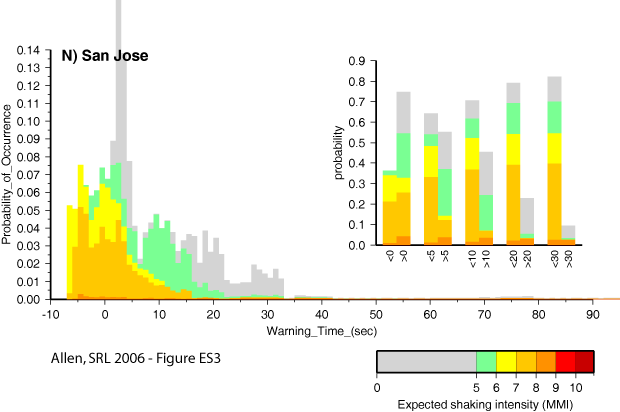
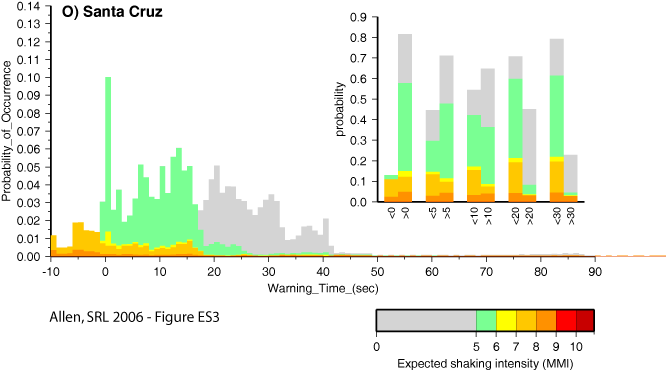
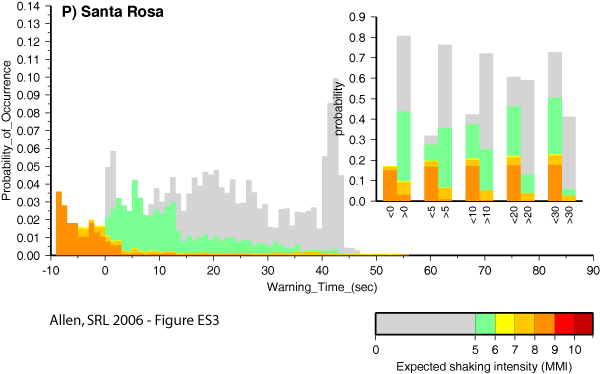
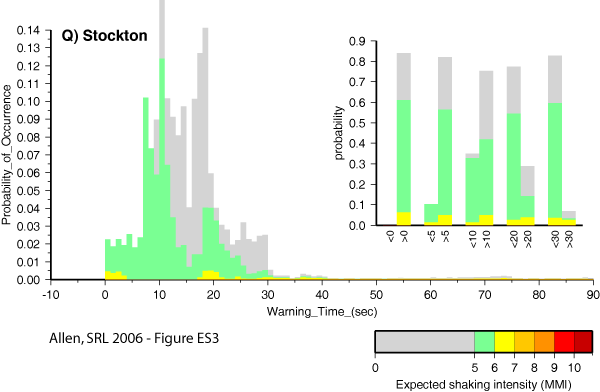
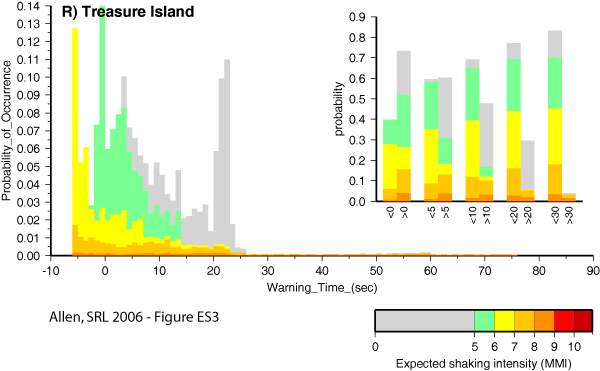
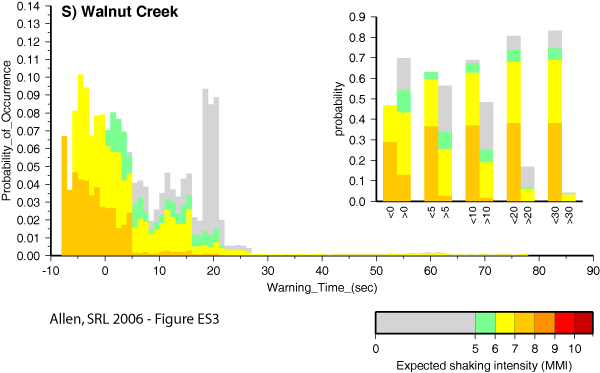
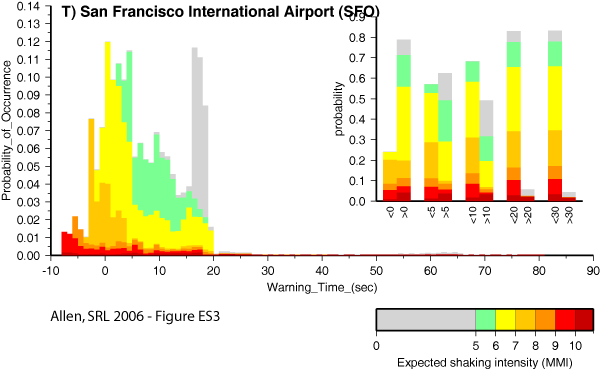
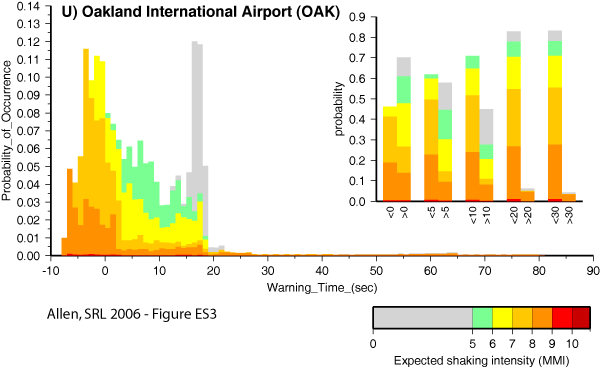
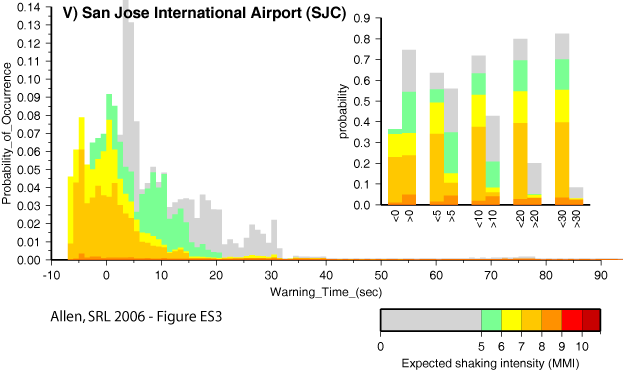
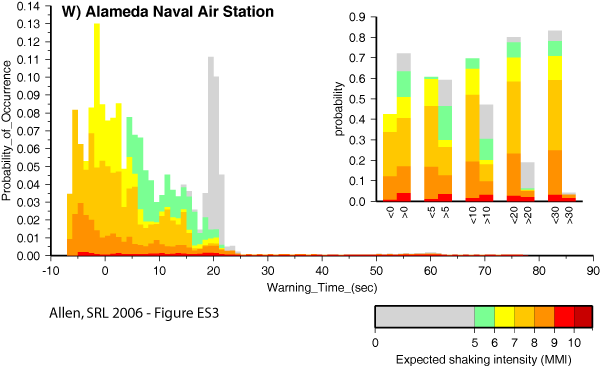
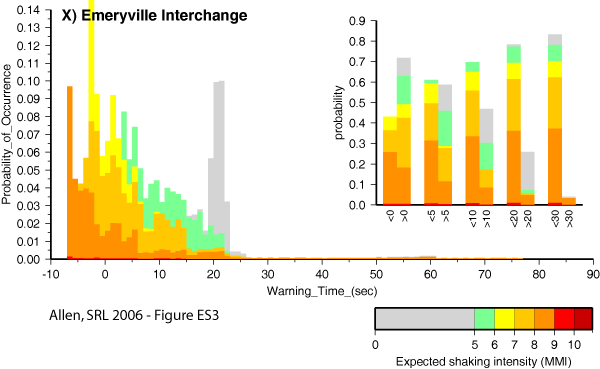
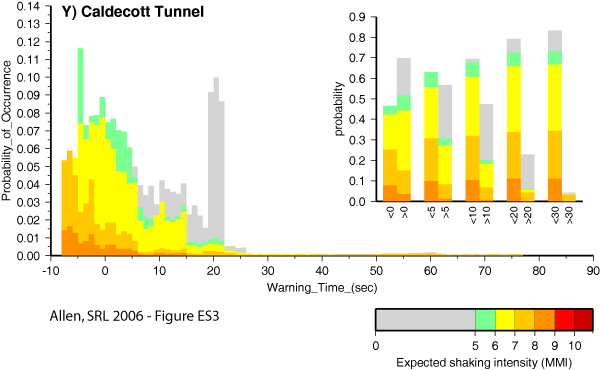
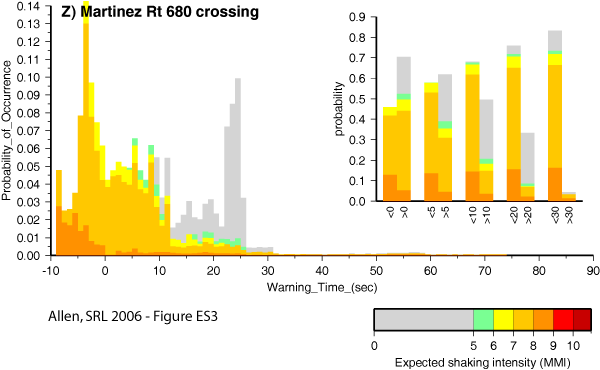
Figure ES3.
Warning time probability density functions (WTPDF) for 26 locations in northern California. The locations are shown on the index map
(Figure ES2)
along with letters referring to panels within Figure ES3.
(View all 26 WTPDFs)
Large charts: The warning times for all likely earthquakes are shown on the scale ranging from -10 sec to 90 sec, where negative warning times mean no warning is possible. Earthquakes are in 1 sec bins and the vertical axis shows the total probability of one or more earthquakes occurring before 2032 for which a given warning time is possible. The color represents the estimated intensity of ground shaking for each event. Damage is unlikely for MMI < V (gray); MMI > IX means violent shaking likely to cause serious damage to buildings (red).
Inset charts: Probability that one or more earthquakes will occur by 2032 for which more or less than 0, 5, 10, 20 and 30 sec warning time could be available. The color indicates the intensity of ground shaking expected.
Panels A-S: Selected cities in northern California
Panels T-V: Airports
Panels W-Z: Sites of engineering interest
more information about earthquake early warning is available:
Richard Allen's homepage and www.ElarmS.org
