
| Home |
| Research |
| Downloads |
| Publications |
| Teaching |
| People |
| Press |
| Allen CV |
| Seismo Lab |
| Earth & Planetary |
| UC Berkeley |
|
Optimal Seismic Network Density for Earthquake Early Warning: |
|
H. Serdar Kuyuk and Richard M. Allen,
University of California, Berkeley Seismo. Res. Lett., 84, 946-954, doi: 10.1785/0220130043, 2013.
Download a preprint:
KuyukAllen-EEWNetworkDesign-SRL-2013.pdf
|
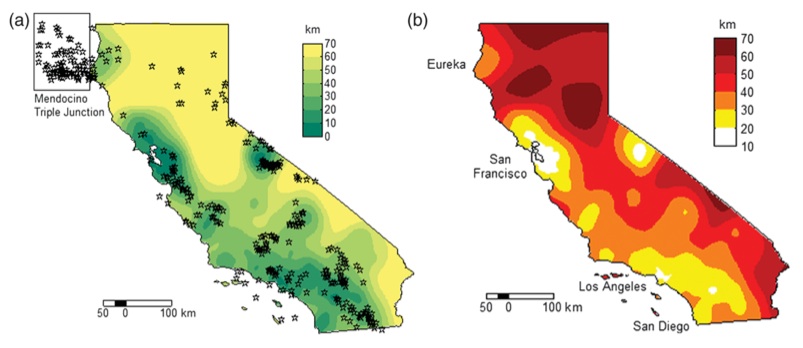
Fig. 8. (a) Epicenters of 407 M > 5 earthquakes from 1900 to 2012 juxtaposed on the interstation-distance contour map. For a given station location, the interstation distance is determined by averaging the distance to the nearest three stations. (b) Map of blind-zone radius for California. Yellow and orange colors correspond to regions with small blind zones and red and dark-red colors correspond to regions with large blind zones. |