
| Home |
| Research |
| Downloads |
| Publications |
| Teaching |
| People |
| Press |
| Allen CV |
| Seismo Lab |
| Earth & Planetary |
| UC Berkeley |
|
The ICEMAN models: | |
|
The PASSCAL-HOTSPOT project started with a deployment of 35 broadband seismometers across Iceland from the summer of 1996 till the summer of 1998. The continuously recorded high quality data has been used to determine the 3D velocity structure of the crust and mantle beneath Iceland. You can download pre-prints detailing the crustal and mantle studies. Here we offer brief descriptions of the mantle models and a variety of 2D and 3D figures showing the velocity structure in the mantle beneath Iceland. See the papers for more details on methods and interpretation of these results. |
|
|
| |
|
Straight to 2D slices through the models
|
Straight to the 3D viewer for models:
|
|
Download the models. You can also download the full model data files along with code to extract velocities. | |
|
Model overview The primary datasets used to generate the iceMAN tomographic models of the Icelandic mantle are teleseismic body-wave arrival times. Relative arrival times for a total of 300 events were measured using a cross-correlation technique. Three independent traveltime datasets were generated. The high-frequency-P dataset was obtained by cross-correlating ~1Hz P and PKIKP arrivals, the velocity model derived from this dataset is called iceMAN-HP. P and PKIKP arrivals were also measured in the 10-30 sec period window to generate the low-frequency-P dataset, the resulting model is called iceMAN-LP. Finally S and SKS arrivals were cross-correlated in the 10-30 sec period window, these were used to generate the iceMAN-S S-velocity model. In addition to these body-wave constraints surface waves were used to complement the S-dataset in the uppermost mantle. The average phase velocities beneath Iceland were used to constrain a 1D absolute S-velocity model for the upper 200 km. The model resulting from the combination of the body-wave and surface wave S-velocity constraints is called iceMAN-Shlvz (for horizontal low velocity zone as constrained by the surface waves). Viewing options Below are brief descriptions of the four models and links to 2D slices through them, and also to a 3D viewer which runs as a Java3D applet in your browser. You will have no problems viewing the 2D slices (jpg images), but you may need to download some plug-ins to make your browser Java3D compatible. Here are some reasons why it is worth the effort. The 3D viewer allows you to fully manipulate the 3D volume, you can spin the data cube in any direction and select the velocity range shown e.g. just low velocities, just high etc using the sliders. This means you can investigate any aspect of the models rather than being constrained to the 2D slices I have pre-selected. First try viewing a model in 3D, if the model doesn't appear you need to get the plug-ins, see the instructions provided. Also see the troubleshooting/tips page for further guidance. Acknowledgments This java applet is the result of a collaboration between LeRoy Dorman and Doug Gehringer at Sun. I am much indebted to them for making the software avaialble and particularily to LeRoy for talking me through its application for these pages. |
| Overviews of the models | |
|
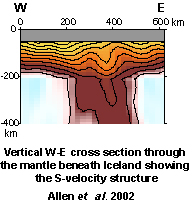
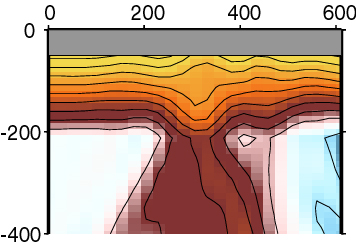
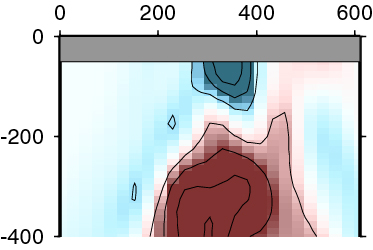
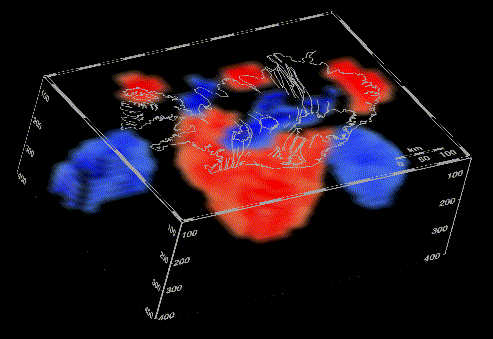
We start with this model as it shows the most complete picture of the low velocity zone beneath Iceland. Horizontal cross-sections show a near-circular low velocity region beneath central-eastern Iceland from the maximum depth of resolution (~400 km) up to ~200 km depth. Above 200 km the model is dominated by a horizontal low velocity region, which extends beneath all of Iceland as constrained by the surface wave constraints. You can look at vertical cross-sections through this model (Plate 1a and 1b) or go 3D. |
|
|
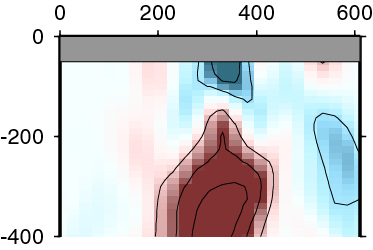
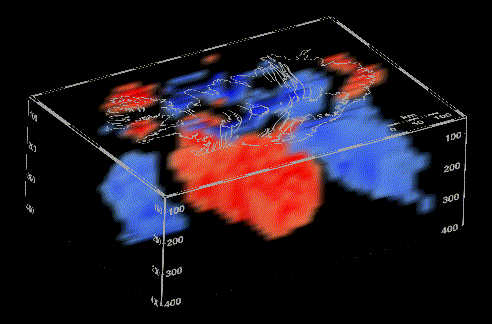
When the surface wave constraints are removed from iceMAN-Shlvz we are left with this model. Now we see the same near-circular low-velocity anomaly extending from 400 km up to 200 km where it fades out. Above 200 km there are only small patches of low velocity. Perhaps most interestingly in the uppermost part of the mantle, at the top of the model, there is a high (blue) velocity anomaly directly above the core of the deeper low-velocity anomaly. The iceMAN-S -LP and -HP models are not able to resolve horizontal velocity anomalies as we are using relative arrival times. You can compare vertical slices through this model (Plate 1c and 1d) with the same slices through iceMAN-Shlvz (Plate 1a and 1b). Of course you can also go 3D. |

|
|
The low-frequency P-velocity model uses P and PKIKP arrivals in the same frequency window as the S and SKS arrivals used in iceMAN-S. Correspondingly the model looks very similar, a low-velocity cylinder extends from 400 km up to 200 km where it stops. There is also a high velocity anomaly from 100 km depth to the base of the moho beneath central-eastern Iceland. Both vertical and horizontal slices are available in Plate 2 central column for comparison with iceMAN-S and iceMAN-HP. You can also explore the full 3D model. |
|
|
The high-frequency P-velocity model perhaps offers the greatest resolution of mantle structure. The velocity variations observed are very similar to iceMAN-HP and iceMAN-S. Vertical and horizontal slices are shown in Plate2 right column, and you can go 3D. |
|
|
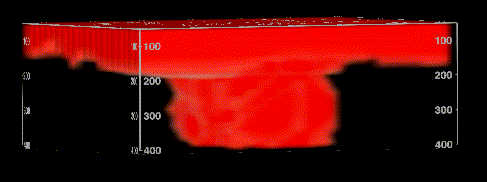
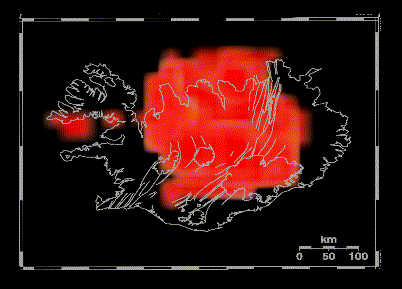
Conclusions These observations are consistent with the existence of a plume conduit extending from 400 km up to 200 km beneath central-eastern Iceland. Above 200 km a horizontal slab of low-velocity material is also consistent with a plume head spreading out beneath the lithosphere. These models do not resolve the source depth of this low velocity anomaly, however, other than to say it must be deeper that 400 km. For more information see the papers on this work. | |
© Richard M Allen