|
Pakistans Nuclear Tests - Seismic Data
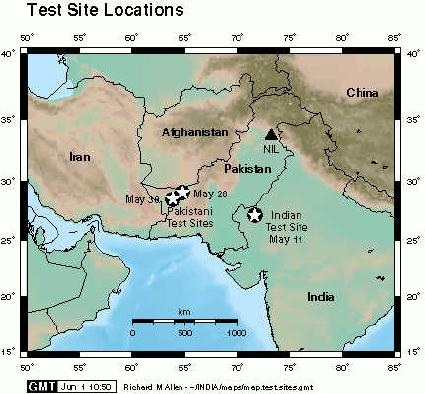
Location The two sets of tests on May 28 and May 30 were conducted at slightly different locations - see map. The locations were determined independently by the National Earthquake Information Center (NEIC) and the Prototype International Data Center (pIDC). | ||||||||||||||||||||||||||||||||||||
| ||||||||||||||||||||||||||||||||||||
|
Test size - yield May 28 Tests While the Pakistani government claims there were five tests on May 28 there is only one seismically recorded event (see data below). There have been reports that there where less than five tests (eg the CIA has evidence of three tests - presumably satellite data). The seismic data is either from the largest explosion or a combination of them all if they all occurred simultaneously. If all detonations occurred at the same time at the same place they would appear as one event in the seismic data. The yield measured for simultaneous tests from the seismic data would be the sum of the individual device yields. The Pakistanis claim three of the devices were sub-kiloton, and the other two had yields of 12 and 25 ktons. We would therefore expect to see a yield of about 37 ktons. We calculate the yields from the event magnitudes listed below.
The two magnitude estimates for the May 28 seismic event are very similar, using these estimates we can estimate the yield at somewhere between 1 and 6 kton. While this is an estimate it is difficult to see how the estimated yield could reach 37 kton. See here for an overview of the yield calculation. This discrepancy between the claimed yield and the observed is very similar to that for the five Indian nuclear tests (Indian test seismic data). May 30 Tests The single test on May 30 was also observed. There have been widely differing reports about the yield of this event up to 18 kton. The observed seismic data suggests a smaller magnitude than for the event on May 28, an Mb of 4.3. This corresponds to a yield of around 1 kton. | ||||||||||||||||||||||||||||||||||||
|
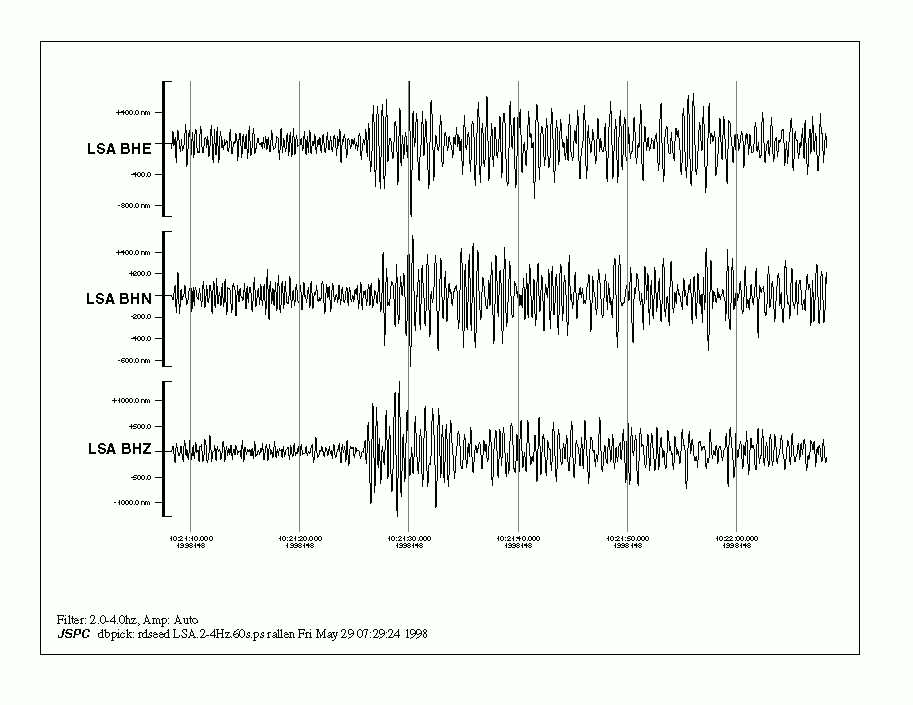
Seismic Waveform Data Below are data from the single seismic event on May 28. The closest seismic data is LSA operated by IRIS 2550 km from the test site in the Chagai Hills - see maps. |
||||||||||||||||||||||||||||||||||||

The three component seismogram above shows the P arrival about a third of the way along the trace (at ~ 10:21:25) and then a larger high frequency arrival towards the end of the trace. This high frequency arrival is most likely a small earthquake close to station LSA. Follow this link for more information on distinguishing this arrival from those of the nuclear test.
Below is a close-up of the P arrival on the vertical component of LSA. The seismogram has be filtered at 2-4Hz to enhance the arrival.
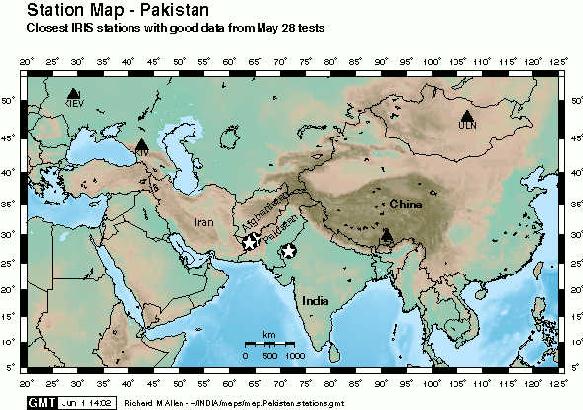
The locations of the closest stations with good data are shown on the map below. |
Also check out...
[news reports] [index and links] [Indian tests] [The Nuclear Monitor]