REFERENCE MODELS
Contents |
On the different flavours of 1D seismic reference models
Introduction
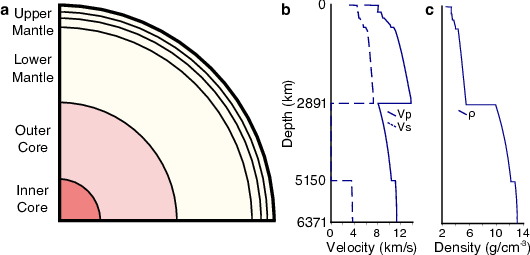
To a very good first order approximation, the earth is made up of concentric spherical shells, and its average internal structure can be described in terms of variations of properties as a function only of depth. Measurements of travel times and amplitudes of seismic waves generated by large earthquakes and observed at distant stations contain information about the elastic and anelastic properties of the medium through which they travel. These measurements can be used to build models of seismic velocity, density, and attenuation structure with depth through mathematical inversion. Earth properties are observed to change laterally and vertically, but change most strongly with depth (lateral velocity variations are at most 10% laterally compared with 500% vertically) thus Earth structure can be well approximated by a 1-dimensional (spherically symmetric) model of elastic velocities, density, and attenuation as a function of depth (Fig. 1). Different 1D reference seismological earth models have been constructed using different data types, different parametrisation, and computation procedures. Knowing what choices have been made in the construction of a 1D seismological reference earth model is important when one wants to use such a model, depending on the application.
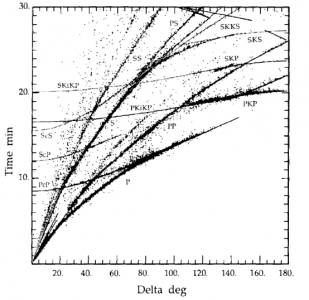
The differing sensitivities of the seismic observables used and the scatter in the measurements caused by lateral velocity structure (Fig. 2) mean that the resulting velocity structure is only an approximation of the true Earth and not representative of any real physical structure, mineral assemblage, or location. Caution must be taken when 1D reference models are used to interpret results from other disciplines, such as measurements or calculations of elastic properties of different mineral assemblages.
While reference models are approximations of the real Earth, they are needed for, among others, the following purposes:
- Determining earthquake locations, which involves converting times to distances and thus requires an understanding of wave propagation velocities.
- Identifying different kinds of seismic waves (phases) on seismic records is guided by calculations of predicted travel-times
- Predicting ray paths requires knowing the velocity structure
- Modelling the propagation of waves from earthquakes requires an understanding of the velocity structure
- Construction of 3D seismic models requires a starting model for the inversion process. Indeed, most of the non-linearity resides in the 1D model.
- Reference models are used to forward model standard travel-times and waveforms against which to compare observations to help identify variability
- Providing a reference for the interpretation of mineral physics experimental and computational data
- Providing a reference structure to inform dynamic modelling
Many current seismological studies rely upon reference models. While global 3D models of the Earth's mantle have been developed for over 30 years (e.g. Dziewonski et al., 1977[3], Dziewonski, 1984[4]), 1D models are still commonly used.
Historical background
The earliest representation of Earth structure was a simple layered model (Table 1) derived from travel-time curves displaying how the time taken for waves to arrive following an earthquake varied with distance e.g. Gutenberg or the Jeffreys-Bullen Tables (Jeffreys, 1940[5], Bullen 1942[6]). These tables were compiled from observations from 1930 to 1939 when the global network of seismometers was very limited. Nonetheless, the International Seismological Centre used the Jeffreys-Bullen tables in their earthquake location process until 1991 (Kennett and Engdahl, 1991[2]).
| Region | Depth (km) | Features of region |
|---|---|---|
| A | 33 | Crustal layers |
| B | 413 | Upper mantle: steady positive P and S velocity gradients |
| C | 984 | Mantle transition region |
| D | 2898 | Lower mantle: steady positive P and S velocity gradients |
| E | 4982 | Outer core: steady positive P velocity gradient |
| F | 5121 | Core transition: negative P velocity gradient |
| G | 6371 | Inner core: small positive P velocity gradient |
Table 1: Regions in Jeffreys-Bullen earth model. After Stein and Wysession (2009[7]).
Later compilations of body wave travel-time tables determined that the Jeffreys-Bullen tables were 2-4 seconds slow and that, due to strong upper mantle heterogeneity, velocities at short distances needed revision (Herrin et al., 1968[8]).
Constructing a model
Constructing a reference model requires a number of choices that depend on: the type of data, computational ease, and the goal of the model. Models are calculated from different datasets and frequencies and may be represented in different mathematical ways. Therefore, different models do not all represent the Earth structure in the same way.
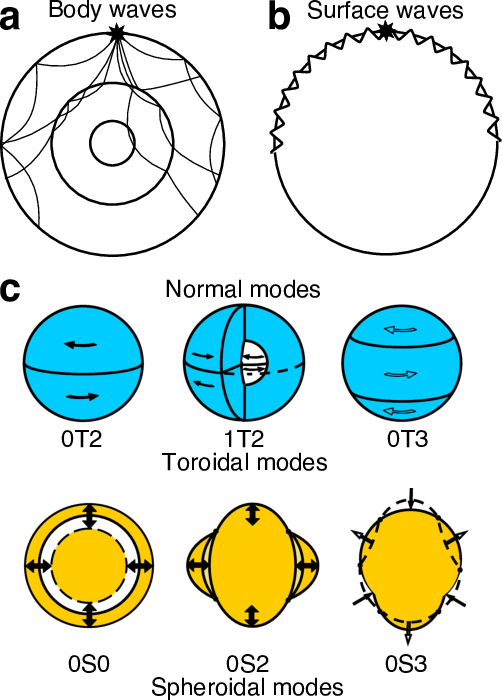
Models are commonly constructed using either long period or short period teleseismic data (Fig. 3). Short period data are sensitive to only small volumes of the Earth thus can be biased by sampling, but can carry precise information about the Earth and are sensitive to the deep Earth. Meanwhile, long period waves are sensitive to larger volumes or, in the case of normal modes, the whole Earth. The frequencies of seismic data used to construct the model affect how the resulting model should be used. Seismic data can be supplemented by other measurements, such as astronomical data. See Table 2 and Data section for more detail.
| Data type | Body-wave travel-times | Body-wave differentials | Surface Waves | Normal Modes | Astronomical Measurements |
|---|---|---|---|---|---|
| Period | ~1-10s | ~1-10 s | 10-100 s | 10s min | N/A |
| Sensitivity | Small volume, whole Earth | Small volume, whole Earth | Large volumes, mostly shallow | Whole Earth average | Whole Earth average |
| Resolved parameters | Vp and Vs | Vp and Vs | Vp, Vs, dispersion, attenuation | Vp, Vs, dispersion, attenuation, density | Density |
| Bias | Continents, seismic regions | Continents, seismic regions | Continents, seismic regions | None | None |
| Complications | Contamination, phase identification, event mislocation | Contamination, phase identification | Cannot resolve discontinuities, limited depth sensitivity | Require large events, limited depth sensitivity, limited lateral sensitivity | Accurate measurements difficult |
Table 2 – Data type summary. More information in Data Type section.
As sampling of the Earth is not geographically even with the vast majority of seismometers being on the mainland, models relying on body waves are often inherently biased towards structure beneath the continents. Meanwhile, normal mode data record whole earth structure without geographic bias. Model construction also involves the decision of where to place the dividing layers and discontinuities, and which to include. Data guides the depth of discontinuities and layers, but models may include different numbers of layers based on what is observed in the data, the purpose of the model, and the choice of the modellers.
Reference models can be defined in different ways, and are often parameterised as mathematical functions e.g. the core velocities of the model IASP91 (Kennett and Engdahl, 1991[2]) are described by a quadratic polynomial. While mathematical parameters likely do not represent the Earth, such parameterisations can allow models to be interpolated at different depths more accurately.
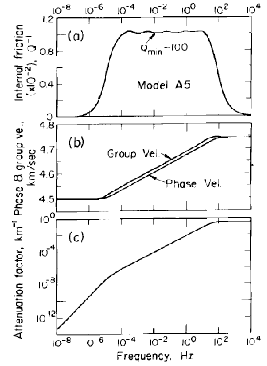
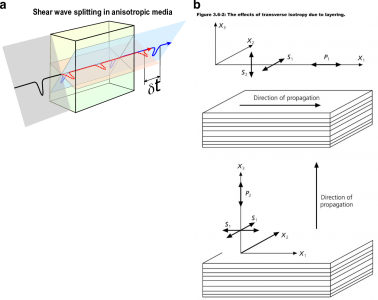
As well as showing lateral and vertical heterogeneities, the Earth is anelastic and anisotropic. Seismic waves are attenuated as they travel through the Earth, which affects observed amplitudes, and also makes wave velocity frequency dependent, which is known as dispersion (Fig. 4). Anisotropy causes waves to travel at different speeds dependent on their direction of travel or their polarization (Fig. 5). These properties are necessary features of reference models to properly represent seismic data. The first 1D reference model to include a realistic representation of attenuation, as well as radial anisotropy down to 200 km depth was PREM (Dziewonski and Anderson, 1981 [1]).
Limitations
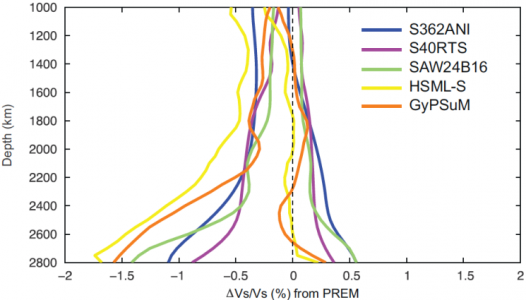
It should be stressed that 1D reference models are zeroth order approximations of the Earth structure (Fig. 1). In order to compute the travel times of seismic waves and compare them to real data, corrections due to earth's ellipticity that depend on the phase used need to be applied. The models often most poorly represent the uppermost and lowermost mantle where lateral velocity variations are strongest (Fig. 6). However, in the construction of these various models, authors are often explicit in stating the limitations of their products:
“An average Earth model, the subject of this work, is a mathematical abstraction. The lateral heterogeneity in the first few tens of kilometres is so large than an average model does not reflect the actual structure at any point.” - PREM (Dziewonski and Anderson, 1981[1])
“It should be stressed that such a velocity model is intended as a summary of seismic travel-times and, because of the uneven geographic distribution of the ray paths sampled by the events in the ISC catalogue, will represent no simple average of the Earth.” – IASP91 (Kennett and Engdahl, 1991[2])
“We stress that model ak135 is designed to represent the smoother empirical travel-times, and so should be very suitable for predicting the arrival times of a wide variety of seismic phases for use in event location or phase association procedures. We have to be cautious about direct interpretation of ak135 as a full representation of seismic velocities in the Earth” AK135 - (Kennett et al., 1995[12])
Using models outside of seismology
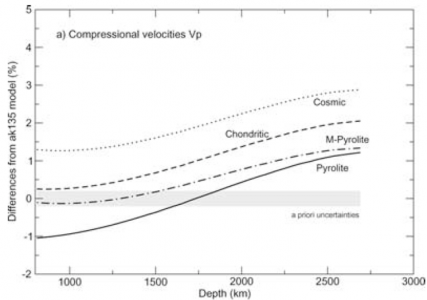
While it is useful to interpret the profiles with depth of elastic parameters in terms of composition and temperature, it is important to appreciate that they actually represent averages over heterogeneous structure. Therefore, care must be taken to not over interpret the model (Fig 7). Meanwhile, models differ hence selection of an appropriate model is important. For example, PREM was designed to dominantly fit whole Earth long period data (surface waves and normal modes) while also including body wave data, hence is best suited for comparison with other disciplines (Table 3).
Models are not equally well defined with depth for P- and S-waves as the regions that can be sampled depend on the phase (Kennett, 2006[14]). Also, the accuracy of the travel-time measurements differs between P- and S-waves owing to the differences in dominant frequencies and contamination within the wavefield. Some chosen features of models make them incompatible with other data e.g. the choice of using linear gradients in AK135 mean that the model is unable to fit adiabat models (Kennett, 2006[14]).
Reference models are usually defined in terms of P and S seismic velocities and density, from which elastic parameters can be inferred. Kennett (2006[14]) argues that models should be defined as bulk and shear moduli and density for ease of comparison with mineral physics experiments. Similarly, tomography models are often described as the deviation from some 1D reference structure. While this makes displaying the structures simpler, any subsequent analysis of those structures will include the limitations inherent in the 1D model. Instead, using absolute velocities would prevent adding additional uncertainty to the data and thus not propagate into further analysis.
Summary of commonly used models
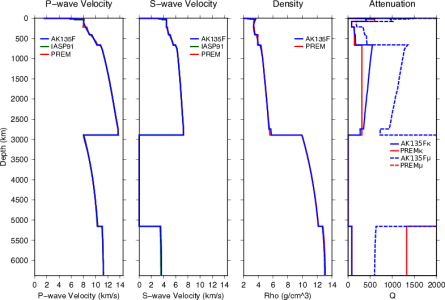
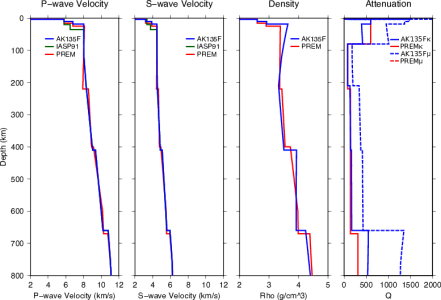
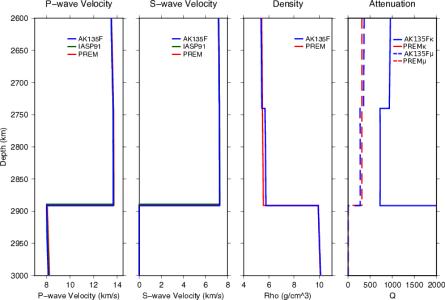
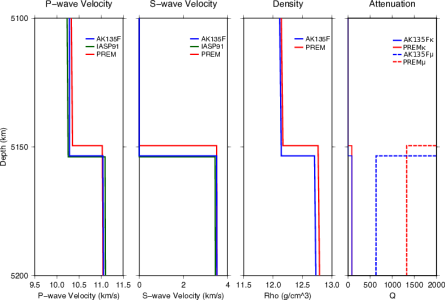
While multiple reference models have been produced, there are three that have been most commonly used up to present: PREM (Dziewonski and Anderson, 1981[1]), IASP91 (Kennett and Engdahl, 1991[2]), and AK135 (Kennett et al., 1995[12]). These models are summarised in Table 3 and their velocity structures are compared in Fig. 7. For more detail on these models, see section Common Models in Detail.
| Model | PREM | IASP91 | AK135 and AK135-F |
|---|---|---|---|
| Reference | Dziewonski and Anderson, 1981, PEPI[1] | Kennett and Engdahl, 1991, GJI[12] | Kennett et al., 1995[12], and Montagner and Kennett et al., 1996, GJI[16] |
| Data used | Body waves, normal modes, surface waves, surface wave dispersion, astronomical observations | Bodywaves (6*106 measurements) | Bodywaves relocated with IASP91, bodywave differentials, plus normal modes (in AK135-F only) |
| Period | 1 s with attenuation corrections for 200 s | 1 s | 1 s |
| Regional bias | Crust thickness is weighted average of continent and ocean, mantle unbiased | Continental crustal thickness used as seismometers are on continents. Upper mantle more biased than lower mantle | AK135: continental thickness used as seismometers on continents, upper mantle more biased than lower mantle. AK135-F: Average crustal structure, upper mantle more biased than lower mantle. |
| Water layer | Yes: 3km thick | No | Yes: 3km thick |
| Resolved parameters | Vp, Vs, Q, density | Vp, Vs | Vp, Vs, plus Q and density (in AK135-F only) |
| Features | Upper mantle discontinuity at 220 km depth | Vp better resolved than Vs | Outer core well resolved by PKP differential travel times, density and Q from Montagner and Kennett (1996) |
| Anisotropic/Isotropic | Transverse anisotropy of 2-4% from 80-220 km depth | Isotropic | Isotropic |
| Best uses in seismology | Long period studies | Body-wave studies, earthquake relocation | Body-wave studies specifically core, earthquake relocation |
Table 3 – Summary of common reference models.
Whole mantle
Upper mantle
Lower mantle
Inner Core Boundary
Towards a 3D Reference model
While 1D reference models are a very good approximation of Earth structure, they are not representative of the Earth at any specific geographic location. Meanwhile, the continued development of tomography has led to broad similarities between different tomographic models (Lekic et al., 2012[13], Garnero et al., 2016[17]). The inherent greater level of detail and regional variability makes a 3D model an attractive prospect for both improving body wave calculations (particularly for amplitude and waveform studies) and as a starting model for further tomographic studies (Lekic report). The model would provide a more appropriate reference for mineral physics studies by being representative of specific regional structures. The proposed model, REM3D, would resolve only the most robust features of tomography, including the lateral variations in the uppermost and lowermost mantle while aiming to fit the dominant spectrum of velocity heterogeneity in each depth region. Constructing this model is the goal of a current working group lead by Lekic, Romanowicz, and Dziewonski (unfortunately recently deceased) and supported by NSF/EAR grant 1345082/1345101/1345103/[18]. See the following link for more information: https://www.geol.umd.edu/facilities/seismology/rem-3d/.
Detailed information
Types of data
Teleseismic Body-waves – waves travelling through the body of the Earth.
- Tend to be high frequency (~0.1-1 Hz) and thus provide detailed information on the depth structure in boundary layers.
- Can travel deeply into the Earth and so help to constrain the deep mantle.
- Affected by source and stations errors for which corrections must be applied.
- Contamination from other phases with similar travel-times and long codas (energy trailing the main arrival) can make identification and accurate measuring of travel-times problematic
- Travel times of body waves are not directly sensitive to density nor attenuation
Teleseismic body-wave differential times – the difference in travel-time between two phases travelling through similar parts of the Earth. The difference or residual time is thus caused by Earth where the paths diverge.
- Accounts for source and station errors and problems with unresolved and strongly varying crustal and upper mantle structure as both phases experience approximately the same effect, thus this is subtracted out.
- Requires correct phase identification
- Cannot resolve density,
Surface waves – long period waves whose energy decays with depth, are sensitive to upper mantle structure
- Provide strong constraints on shallow structure especially across ocean basins where sampling by teleseismic body waves is poor.
- Cannot resolve discontinuities
Normal modes/free oscillations – oscillations of the Earth as a whole on very long timescales (minutes to almost 1 hour)
- Contain information averaged over the whole Earth thus are ideal for measuring 1D structure
- Lateral and vertical resolution dependent on frequency used
- Limited lateral resolution due to the long periods used.
- Limited resolution of deep mantle
- Sensitive to gravity (at least for periods longer than 200 s) thus contain information about Earth’s density
- Constrain attenuation structure of whole Earth
Astronomical measurements – moment of inertia, Earth’s radius and mass than can be used to infer density structure based on physical equations such as the Adams-Williamson equation and Birch’s law.
Common models in detail
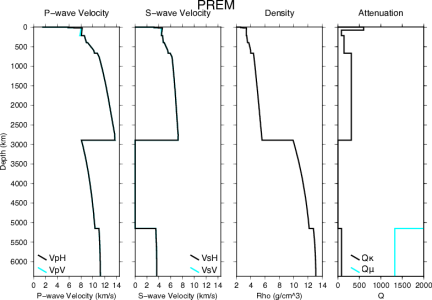
PREM (Dziewonski and Anderson, 1981[1]) – Fig. 8
Developed in response to the request by an international committee of IUGG to build a standard 1D model for the Earth, the Preliminary Earth Reference Model (PREM) utilises constraints from a range of seismic wave types along with astronomical measurements. What sets it apart from previous 1D models is the inclusion of radial anisotropy in the uppermost mantle and 1D attenuation structure throughout the earth. PREM is based on measurements of normal mode eigenfrequencies (1000 modes), summary teleseismic body travel-times (500 summary observations), individual P and S teleseismic travel-time observations (1.75*106 observations from 12 years of ISC data), normal mode attenuation (Q) measurements, mass, and moment of inertia of the Earth. The data were inverted to retrieve Vs, Vp, density, and Qk and Qμ as a function of depth. Radial anisotropy was introduced in the first 200 km at the top of the mantle.
The crust layer is defined to be 24.4 km, the weighted mean of the 35 km thick continental crust covering roughly 1/3 of the Earth’s surface, and the 11 km thick oceanic crust accounting for 2/3 of the surface. This includes a 3km thick water layer. The outer and inner cores were assumed to be individually homogeneous and finite strain theory was used to construct the starting models. Birch’s law (Birch, 1964[19]), the Adams-Williamson equation, mass and moment of inertia measurements were used to calculate density.
The Adams-Williamson equation relates seismic velocities (described as the seismic parameter) and the mass of the Earth to density as a function of depth (Williamson and Adams, 1923[20]). The equation only works when the temperature gradient can be assumed to be adiabatic (where temperature is only a function of pressure) and the composition is homogeneous, thus departures from the predicted density imply a non-adiabatic temperature gradient or compositional change. For example, in thermal boundary layers the Adams-Williamson equations require corrections to correctly explain the density (Birch, 1952[21]).
To account for uneven sampling of the Earth with body waves, measurements are summarised in equal area cells and the results are averaged between cells. Step discontinuities are introduced at 400, and 670 km based on previous studies (not stated in the paper). A change in the gradient of velocity with depth is introduced at 2741 km depth based on an observed sharp change in the slope of body wave travel-times with increasing distance, corresponding with the D" region. The 220 km, or Lehmann, discontinuity is a special feature of this model, which is somewhat controversial, as it is not globally observed in contrast to the transition zone discontinuities. It was introduced to mark the base of the radially anisotropic upper mantle zone. The lithospheric thickness was set at 80 km. Discontinuities were assumed to be the same for both P and S waves.
Transverse anisotropy (SV and SH polarized waves travelling at different speeds. See Fig. 5) of about 2-4% for both P and S waves is included between 80 and 220 km depth to reconcile Rayleigh and Love-wave dispersion measurements. The model was designed to be valid for a reference period of 1 s, but was also tabulated for a reference period of 200 s. Knowing the attenuation structure, corrections for computation at any desired reference period can be calculated. PREM is given as a table giving values of density, P-wave speeds for horizontally and vertically polarised waves (VPH and VPV, respectively), S-wave speeds for horizontally and vertically polarised waves (VSH and VSV, respectively), and bulk and shear attenuation (Qκ and Qμ, respectively) and η at different radii (where η is the 5th radially anisotropic parameter). There is also a parametric version of PREM allowing accurate interpolation of the model at any vertical spacing.
PREM has been very successful as a reference model up to this day. Its main drawback is the presence of the somewhat artificial 220 km discontinuity, and the depths of the transition zone discontinuity, for which more modern average values are closer to 410 and 660 km. Also, the gradients of P velocity at the top and bottom of the outer core are less suitable for travel time studies of core phases than those of AK135 (see below).
IASP91 (Kennett and Engdahl, 1991[2]) – Fig. 9
IASP91 was constructed by the sub-commission on Earthquake Algorithms of the International Association of Seismology and Physics of the Earth’s Interior (IASPEI) to be easily adaptable to any problem by allowing simple interpolation for different depths. The model uses 6x10⁶ bodywave arrival times (P- and S-waves) from 3000 stations collected over 1964-1987 by the ISC. It was designed to be used for earthquake location, improving over the Jeffreys-Bullen tables developed in 1940 that were being used until then. The model was built to fit 1 Hz data.
The crust is chosen to be representative of the continents as the majority of the reporting stations are located there and the major use of the model is to predict teleseismic travel-times. Hence, the crustal layer is 35 km thick, split into two layers by a discontinuity at 10 km depth. The model does not include a water layer.
Velocities are parameterised as various linear, quadratic, and cubic polynomials and different phases are reduced to their ray parameter, which makes computation simpler. Mantle discontinuities are set at 410 km and 660 km depths. In the lowermost mantle there is a gradient change at 2740 km depth into the D`` layer. The inner and outer core radii were set using a normal mode inversion that was not part of this study (Masters, unreferenced) and the core velocity structure was taken from the PEM model constructed using constraints from normal modes (Dziewonski et al., 1975[22]).
The authors state the upper mantle structure (distances <30° down to 760 km depth) to be a biased average as the waves used to define the velocity in this region are strongly affected by the large lateral variations in seismic wavespeed at the top of the mantle. P-wave structure is said to be better resolved than the S-wave structure as P-wave travel times are easier to measure due to the clearer time window in which they arrive and being generally higher frequency. The upper mantle velocities are likely more biased by the uneven source and receiver location than the lower mantle. The model was verified using test events, a collection of nuclear explosions and earthquakes for which the location and origin time were precisely known.
AK135 and AK135F – (Kennett et al., 1995[12], Montagner and Kennett, 1996[16]) – Fig 10
AK135 was built to refine IASP91 by using the IASP91 model and ISC travel-times to improve travel-time accuracy and increase the fit to core phases. An updated model (AK135F) was inverted including normal mode data to constrain attenuation and density (Montagner and Kennett, 1996). AK135F is distributed as both a spherical average and a continental model with and without a water layer, respectively. The upper 1000 km of the outer core velocity structure (P-waves only as S-waves don’t propagate in liquids) had previously been poorly resolved as the raypaths of the PKP branches used sampled deeper into the core. In this model, previously unused branches of PKP were included (PKPab and PKPbc). Newly measured differential travel-times between different branches of PKP (each of which have slightly different paths thus sample different depth ranges in the outer core) were used to improve outer core structure.
The ISC event dataset was relocated using the IASP91 model, which was better constrained than the Jeffreys-Bullen model that had originally been used in determining event locations. New travel-time tables were constructed with the updated event locations, and these new tables were used to build models that were then tested against the observed data. The model realisation with the smallest misfit, AK135, was selected as the new Earth model. Certain phases were excluded from the inversion: direct P and S waves at distances <25° that are known to be strongly affected by uppermost heterogeneous mantle structure, and P and S coda phases of which the onset times are more difficult to pick. The core structure is developed starting from the SP6 model (Morelli and Dziewonski, 1993[23]). Model is non-parametric.
In AK135, the crustal thickness is set to 35 km as the majority of seismometers are on the continents. In AK135F the crustal thickness is chosen to be 18 km with, in addition, a 3 km thick water layer, to match the additional constraints added in this model. Attenuation structure is introduced to obtain agreement between the high frequency body wave data and the normal modes. The largest difference from other models is at the inner core boundary due to the addition of PKP differential times.
Other models
1066A/1066B (Gilbert and Dziewonski, 1975[24]) – Calculated using the observed eigenfrequencies of 1064 free oscillations as well as the mass and moment of inertia of the Earth.
PEM (Dziewonski et al., 1975[22]) – Free oscillations and travel-times fit parametrically.
These models were abandoned after PREM was developed because PREM built up and significantly improved over these models using similar data types but with additional measurements and constraints making is more representative of Earth structure.
SP6 (Morelli and Dziewonski, 1993[23]) – An updated travel time-based model using shallow earthquakes specifically. The model improves fit with SKS and SKKS phases and has marginally different uppermost and lowermost mantle structure from iasp91.
STW105 - More recently: this 1D transversely isotropic model from Kustowski et al. (2008[25]) is sometimes preferred as a starting model for tomography, because it does not have the 220 km discontinuity. It is however not meant to be a reference 1D earth model.
References
- ↑ 1.0 1.1 1.2 1.3 1.4 1.5 A M Dziewonski and D L Anderson. Preliminary reference Earth model. Physics of the Earth and Planetary Interiors, 25(4):297{356, jun 1981. ISSN 00319201. doi: 10.1016/0031-9201(81)90046-7
- ↑ 2.0 2.1 2.2 2.3 2.4 2.5 B L N Kennett and E R Engdahl. Traveltimes for global earthquake location and phase identfication. Geophys. J. Int., 105: 429-465, 1991.
- ↑ A M Dziewonski, B H. Hager, and J O Connell. Large-scale heterogeneities in the lower mantle. J. Geophys. Res., 82: 239-255, 1977.
- ↑ A M Dziewonski. Mapping the Lower Mantle : Determination of Lateral Heterogeneity in P Velocity up to Degree and Order 6. J. Geophys. Res., 89:5929-5952, 1984.
- ↑ H. Jeffreys and K E Bullen. Seismological tables. British Association Seismological Committee, London, 1940.
- ↑ K E Bullen. The density variation of the Earth's central core. Bull. seism. Soc. Am., 32:19-29, 1942.
- ↑ 7.0 7.1 7.2 S Stein and M Wysession. An Introduction to Seismology, Earthquakes, and Earth Structure. Wiley-Blackwell, 2009.
- ↑ B Y E Herrin, W Tucker, J Taggart, D W Gordon, and J L Lobdell. Estimation of Surface Focus P Travel Times. Bull. seism. Soc. Am., 58(4):1273-1291, 1968
- ↑ IRIS: http://www.iris.iris.edu/sumatra/
- ↑ H Liu, D L Anderson, and H Kanamori. Velocity dispersion due to anelasticity; implications for seismology and mantle composition. Geophys. J. R. astr. Soc., 47:41-58, 1976.
- ↑ Ed Garnero's website:http://garnero.asu.edu/research_images/index.html
- ↑ 12.0 12.1 12.2 12.3 12.4 B L N Kennett, E R Engdah, and R Buland. Constraints on seismic velocities in the Earth from traveltimes. Geophys. J. Int., 122:108-124, 1995
- ↑ 13.0 13.1 V Lekic, S Cottaar, A Dziewonski, and B Romanowicz. Cluster analysis of global lower mantle tomography: A new class of structure and implications for chemical heterogeneity. Earth and Planetary Science Letters, 357-358:68-77, dec 2012. ISSN 0012821X. doi: 10.1016/j.epsl.2012.09.014. URL http://linkinghub.elsevier.com/retrieve/pii/S0012821X12005109.
- ↑ 14.0 14.1 14.2 B L N Kennett. On seismological reference models and the perceived nature of heterogeneity. Phys. Earth planet. Int., 159: 129-139, 2006. doi: 10.1016/j.pepi.2006.07.006.
- ↑ J Matas, J Bass, Y Ricard, E Mattern, and M S T Bukowinski. On the bulk composition of the lower mantle : predictions and limitations from generalized inversion of radial seismic profiles. Geophys. J. Int., 170:764-780, 2007. doi: 10.1111/j.1365- 246X.2007.03454.x.
- ↑ 16.0 16.1 J Montagner and B L N Kennett. How to reconcile body-wave and normal-mode reference earth models. Geophys. J. Int., 125: 229-248, 1996.
- ↑ E J Garnero, A K Mcnamara, and S Shim. Continent-sized anomalous zones with low seismic velocity at the base of Earths mantle. Nature Geosci., pages 1-9, 2016. ISSN 1752-0894. doi: 10.1038/ngeo2733.
- ↑ V Lekic, Collaborative Research: Developing a Three-Dimensional Seismic Reference Earth Model (REM-3D) in Collaboration with the Community
- ↑ F Birch. Density and composition of mantle and core. J. Geophys. Res., 69:4377-4388, 1964
- ↑ Williamson and Adams. Elastic Properties and Equations of State. Journal of the Washington Academy of Sciences, 13:413-428, 1923.
- ↑ F Birch. Elasticity and constitution of the Earth's interior. J. Geophys. Res., 57(2):227-286, 1952.
- ↑ 22.0 22.1 A M Dziewonski, A L Hales, and E R Lapwood. Parametrically simple earth models consistent with geophysical data. Phys. Earth planet. Int., 10:12-48, 1975
- ↑ 23.0 23.1 Andrea Morelli and M Dziewonski. Body wave traveltimes and a spherically symmetric P- and S-wave velocity model. Geophys. J. Int., 112:178-194, 1993.
- ↑ F. Gilbert and A M Dziewonski. An application of normal mode theory to the retrieval of structural parameters and source mechanisms from seismic spectra. Phil. Trans. R. Soc. Lond A, 278:187-269, 1975.
- ↑ B Kustowski, G Ekstrom, and A M Dziewoski. The shear-wave velocity structure in the upper mantle beneath Eurasia. Geophys. J. Int., 174:978-992, 2008. ISSN 0956540X. doi: 10.1111/j.1365-246X.2008.03865.x.
