
|
|
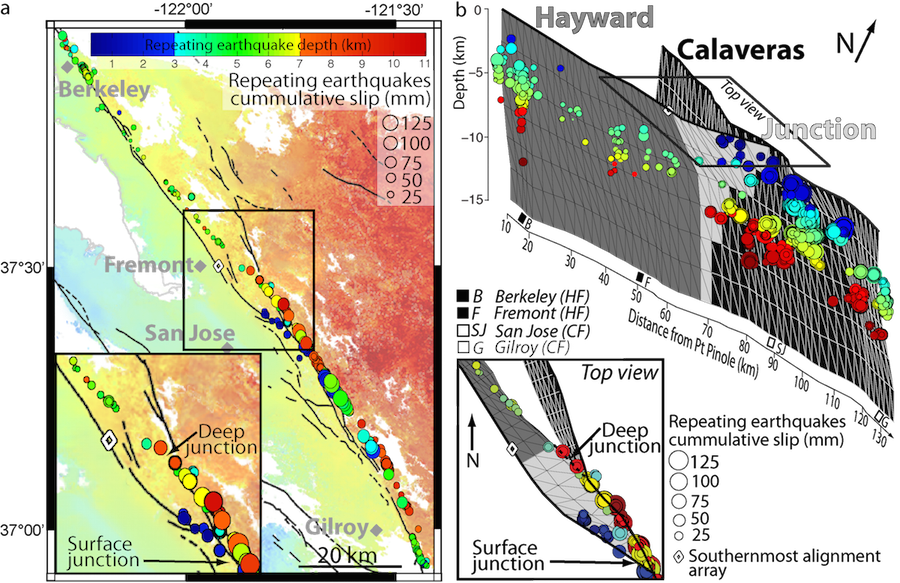
Figure: a) Characteristically Repeating Earthquakes (CREs) color-coded by depth and with radius proportional to their 1992-2011 cumulative slip overlaying the mean 1992-2011 InSAR ground velocity. Shallow CREs (blue) confirm the continuation of the Haywad Fault (HF) surface creep observed in the InSAR velocity map up to 15 km farther south than the southernmost alignment array (diamond) in Fremont and the surface connection with the Calaveras Fault (CF). Continuous CREs between the CF and HF illuminate the junction at depth, 10 km north of the surface junction. The black box (bottom left inset) enlarges the region of the junction. b) Model of the refined geometry of the HF (grey) and CF (black). The surface traces of the faults are based on the InSAR gradient map and the geometry at depth is based on the CREs (circles). The light grey mesh highlights the newly established connection between the two faults.
| Project Summary |
The Hayward and Calaveras Faults, two strike-slip faults of the San Andreas Fault System passing through the East San Francisco Bay Area and accommodating ~30% of the relative motion between the North American and Pacific plates, are commonly considered independent structures for seismic hazard assessment. Here we use InSAR to show that surface creep on the Hayward Fault continues 15 km farther south than previously known, revealing new potential for rupture and damage south of the city of Fremont. The extended trace of the creeping Hayward Fault, also illuminated by shallow repeating micro-earthquakes, documents a surface connection between the Hayward and Calaveras Faults. At depths greater than 3-5 km, repeating micro-earthquakes located 10 km north-northwest of the surface connection highlight the 3-D wedge geometry of the junction. Our new model of the Hayward and Calaveras Faults argues that they should be treated as a single system with potential for earthquake ruptures generating events with magnitudes significantly greater that 7, posing a higher seismic hazard to the San Francisco Bay Area than previously considered in most assessments.
We resolve 1992-2011 interseismic deformation in the San Francisco Bay Area using InSAR time-series analysis of over 250 ERS and Envisat SAR acquisitions. To maintain coherence across the Calaveras fault, despite the transition from urban areas to vegetated hillslopes, we develop an alternative Small Baseline Subset (SBAS) time series method, in which the image-pair selection is based on the percentage of coherent pixels in each interferogram in an area that spans the fault. The 19 years mean horizontal velocity map obtained by combining multiple viewing geometries allows for direct comparison with BAVU3 GPS velocities showing an agreement of ±2 mm/yr, demonstrating that InSAR enables resolving vertical and horizontal deformation partitioning in the Bay Area for signals as small as 2 mm/yr over both short and long wavelengths. The high spatial resolution of the InSAR velocity map enables identification of the southernmost occurrence of creep on the Hayward fault, which is located ~15 km farther south than previously documented from alignment arrays (in Fremont). We rely on Characteristically Repeating Earthquakes (CREs) to refine our understanding of the interaction between the Calaveras and Hayward faults. Repeating earthquakes can be grouped in three categories: 1) small cumulative slip and medium depths (3-7 km), characteristic of the northern Hayward fault; 2) large cumulative slip and medium to large depths (3-11 km), characteristic of the Calaveras fault; and shallow events (less than 3 km), occurring only at the junction between the Hayward and Calaveras faults. These shallow repeaters align well with the southernmost Hayward creep observed on the InSAR velocity map, suggesting that the two faults’ surface traces meet at this location. On the other hand, the intermediate depth repeaters are essentially continuous between the central Hayward and south Calaveras faults ~10 km farther north than the surface creep, suggesting that the Hayward fault dips to the northeast and the two faults merge farther north at depths of ~5 km. We develop a model of the 3D geometry of the Hayward-Calaveras junction with surface traces based on the InSAR velocity gradient map and the geometry at depth (dip) derived from the CRE locations (Figure). Our new model of the Hayward-Calaveras Fault zone geometry argues for a direct connection via a dipping wedge-shaped fault plane to reconcile the occurrence of creep 10 km south of the deep Mission Peak connection. Accordingly, the two faults should be treated as a single, continuous structure with potential for earthquake ruptures propagating across. The increased length of a potential rupture involving the Hayward and central Calaveras Faults (up to ~160 km long) could generate earthquakes much larger than M7, especially given that creeping patches may participate in a rupture in the presence of dynamic weakening. Our new geometry of the Hayward-Calaveras Fault zone should be used as a basis for earthquake process modeling and ground motion simulations to reevaluate seismic hazard in the Bay Area. |
| Tools | InSAR, Characteristically Repeating Earthquakes |
| Geographic Location | San Francisco Bay Area, California |
| Project Duration | Summer 2014-Summer 2015 |
| Group Members Involved | Estelle Chaussard, Roland Bürgmann, Robert Nadeau, Taka'aki Taira, Christopher W. Johnson, Ingrid Johanson |
| More Information | In Review |
|
|