
|
|
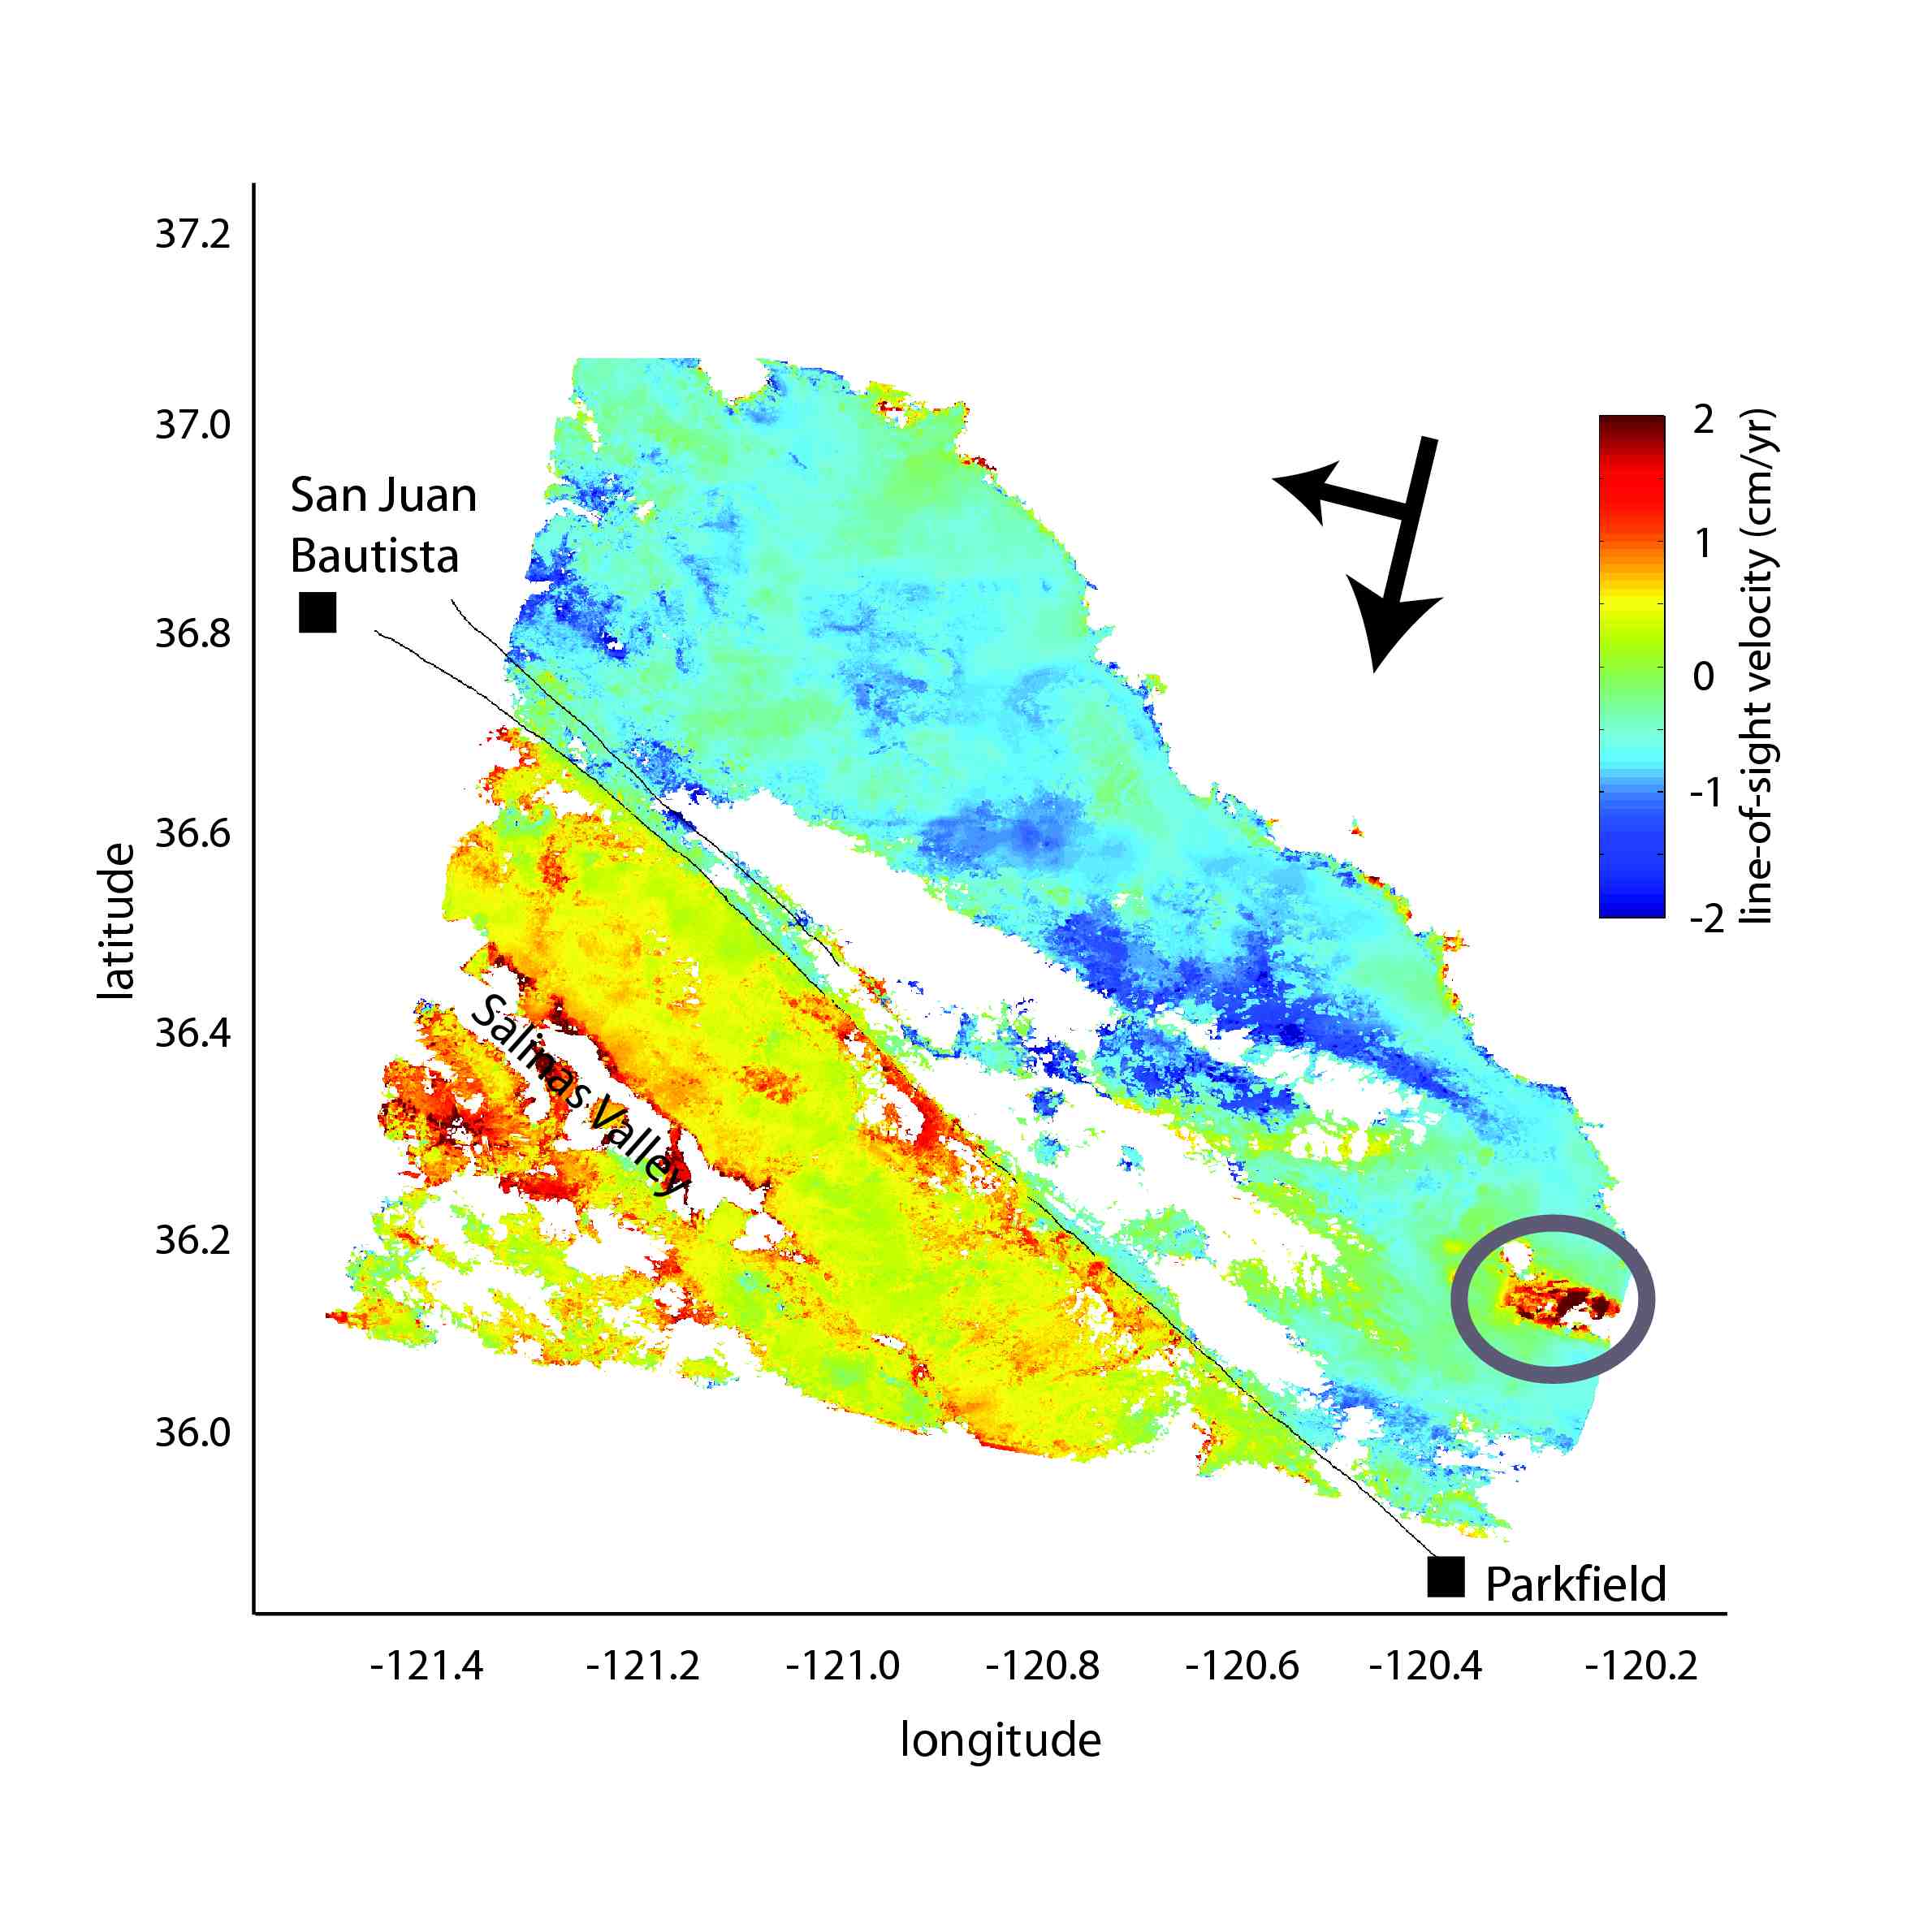
Figure 1. Stack of 12 descending ERS interferograms made from SAR scenes acquired between May 1992 and January 2001. Colours show range change, which is the surface displacement in the line of sight between the satellite and the ground. Red is positive range change, i.e. motion away from the satelite. Arrows show satellite ground track (towards south-southwest) and look direction (towards west-northwest). Fault traces for the CSAF and Calaveras Fault are marked. The line-of-sight offset rate across the fault is 10 mm/year, which is equivalent to a right lateral displacement rate of 32 mm/year. Grey ellipse in bottom right outlines area of suspected subsidence, possibly related to oil pumping near Coalinga. Subsidence may also be occurring in the agricultural Salinas Valley.
| Project Summary |
The San Andreas Fault system stretches from the southern California
border 1,100 km northeastwards right up to the Mendocino triple
junction offshore northern California. For much of its length, the
fault is locked, displaying no significant offset between large
seismic events. The parts of the fault that ruptured during the 1857
M 7.9 Fort Tejon earthquake and the 1906 M 7.9 San
Francisco earthquake are examples of portions of the fault that are
locked. In between these two rupture zones lies the 170 km-long
creeping segment, from now on abbreviated CSAF. Various types of
surface measurement in the last three decades or so have amply
demonstrated that creep occurs along this section, with estimated
creep rates up to 34 mm/year (Burford and Harsh, 1980; Lisowski and
Prescott, 1981; Schulz, 1982; Schulz, 1989;
Titus et al., 2005). Since the discovery of creep at the Cienega
Winery by Tocher in 1960 (Tocher, 1960), the CSAF has
essentially become the world's type locality for fault creep: no other
fault section is known to creep along such a great length, nor at such
a high rate. Several other faults in the San Andreas Fault system have
well-documented creep, for example the Calaveras Fault (e.g. Rogers and
Nason, 1971; Johanson and B\"urgmann, 2005) and the
Hayward Fault (e.g. Savage and Lisowski, 1993; Simpson et
al., 2001), but the rates are less than 10 mm/year. Why some faults
creep while others are locked is not known. It is, however, important
to study this question. Collectively, the creeping faults in the San
Francisco Bay region constitute a major part of the San Andreas Fault
system; if we are to know the system well enough to predict
earthquakes, then we need to understand the mechanics of creep. In
this project we use Interferometric Synthetic Aperture Radar (InSAR)
measurements covering almost a decade to record spatial variations in
creep rate along the CSAF. We then invert these surface data for
shallow creep rates and deep slip rates on the the fault.
|
| InSAR Observations |
We use SAR data from the European ERS-1 and ERS-2 satellites acquired
between May 1992 and January 2001 to construct interferograms across
the CSAF. Agriculture in the Salinas valley and the San Joaquin basin
result in temporal decorrelation in many of the interferograms, and
steep topography, particularly on the northeast side of the fault,
leads to geometrical decorrelation. Collectively, these zones of
incoherence lead to isolated patches in the unwrapped
interferograms. Figure 1
shows a stack of twelve interferograms which can
be unwrapped consistently across the fault.
The stack assumes a linear
velocity for each pixel. The fault is clearly delineated by the abrupt
offset running northwest to southeast across the stack image. The
displacement gradient near the fault is much greater than would be
expected for a fault locked to the bottom of the seismogenic layer
(about 12-15 km in this region), implying that significant shallow
slip occurred during the decade of observation. The positive range
change on the southwest part of the image is enhanced in the Salinas
Valley. We surmise that this enhancement is due to subsidence caused
by aquifer discharge in this highly agricultual area. The area of
10 mm/year positive range change in the southeast quadrant of the
stack exactly coincides with the town of Coalinga and the nearby oil
fields. It is possible that this range change anomaly is due to
pumping of oil. The agreement of our 9-year creep rate with estimates
obtained by other workers over earlier and/or longer periods of time
show that creep rate on the years to decadal time scale has been
approximately constant over the last 30 years. If there was any
increase in creep rate as a result of either the 1857 Fort Tejon or
the 1906 San Francisco earthquake, then presumably the rate has now
levelled off.
|
| To obtain an idea of the distribution of creep rate, we perform inversions using both the InSAR stack and GPS velocities. The CSAF is well-covered by continuous (Plate Boundary Observatory) and campaign GPS sites. Initially, separate InSAR and GPS inversions are carried out, as preliminaries to a joint inversion. The InSAR stack is downsampled by a factor of 20 in the north and east directions. Slip is constrained to be positive (i.e. right-lateral), and an upper bound of 40 mm/year on the slip rate is imposed. In the joint inversion, a maximum shallow creep velocity of 33 mm/year occurs in the centre of the segment, and to first order tapers off on either side, more rapidly to the south than to the north. This mirrors the pattern illustrated in Figure 3 of Titus et al. (2005), which is a compilation of surface geodetic slip rate estimates from different workers since the 1970s. Shallow creep rate falls to very low values (10 mm/year) around Parkfield. Intermediate depth creep rates reach a maximum of 38 mm/year just north of centre, tapering off to the north, and decreasing before rising again towards Parkfield. The deep slip rate is about 35 mm/year. | |
| Tools | InSAR processing and analysis, GPS data analysis, elastic dislocation modeling |
| Geographic Location | Northern Tibetan Plateau |
| Group Members Involved |
Isabelle Ryder, Roland Bürgmann |
| Project Duration | In Progress: start of 2007 through 2009 |