| Home |
| Research |
| Downloads |
| Publications |
| Teaching |
| People |
| Press |
| Allen CV |
| Seismo Lab |
| Earth & Planetary |
| UC Berkeley |
Why the United States is becoming more vulnerable to natural disasters
G. van der Vink, R. M. Allen, J. Chapin, M. Crooks,
W. Fraley, J. Krantz, A. M. Lavigne, A. LeCuyer, E. K. MacColl,
W. J. Morgan, B. Ries,
E. Robinson, K. Rodriquez, M. Smith, K. Sponberg.
Dept. Geosciences, Princeton University,
Guyot Hall, Princeton, NJ 08544 USA.
EOS, Transactions, American Geophysical Union, vol 79, p533-537
November 3, 1998
Download pdf reprint of the complete article
(6.6Mb).
The United States is becoming more vulnerable to natural hazards mostly
because of changes in population and national wealth density -- more people
and more societal infrastructure have become concentrated in disaster-prone
areas. For most of the 20th century, the United States has been largely
spared the expense of a catastrophic natural disaster. A great earthquake
(magnitude 8 or larger) has not struck a major metropolitan area since the
1906 San Francisco earthquake. An extreme or catastrophic hurricane (Class
4 or 5) has not struck directly a major urban area since the one that hit
Miami, Florida, in 1926. Yet even without such disasters, which might
create losses well over $100 billion, the overall costs of natural hazards,
such as extreme weather, drought, and wildfires, are estimated at $54
billion per year for the past five years, or approximately $1 billion per
week [National Science and Technology Council, 1997].
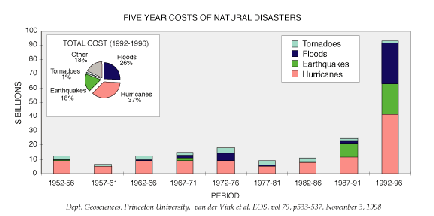
Fig. 1. Five-year costs of natural disasters.
In the United States, the direct costs for damage repair average about $20
billion per year, of which over $15 billion is due to earthquakes,
tornadoes, hurricanes, and floods (Figure 1). The percentage of national
wealth spent on homeowners' and property/casualty insurance has remained
approximately constant with respect to the gross national product [Council
of Economic Advisors, 1994; U.S. Census Bureau, 1997a]. Accordingly, we
infer that the increase in cost is not simply an artifact of more insured
losses being reported, but rather represents a real increase in property
loss from natural hazards.
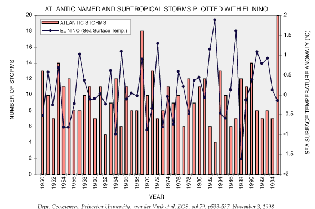
Fig.2. Atlantic named and subtropical storms plotted against the El Nino
Southern Oscillation as shown by the average May-June Sea Surface
Temperature anomaly. Data from Bermuda Biological Station for Research[1997]; NOAA Atlantic Oceanographic and Meteorological Laboratory
(http://www.aoml.noaa.gov/hrd/tcfaq/tcfaqHED.html); and NOAA Climate
Prediction Center (http:nic.fb4.noaa.gov:80/data/).
Figure 2 is a plot of the number of landfalling hurricanes along with the
sea surface temperature anomaly that serves as an indicator of El Nino.
During an El Nino phase, the sea surface temperature anomaly is high and
the number of storms is low (in 1983 for example). During La Nina (the
opposite of El Nino), the anomaly is low and the number of storms is high
(in 1988 for example). As seen in the time series, there does not appear
to have been a significant increase in the occurrence of hurricanes over
the last decade, although El Nino and La Nina provide an explanation for
which years have more or fewer.
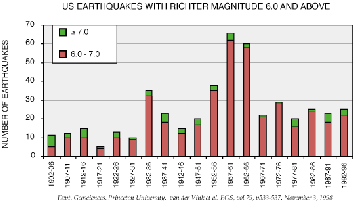
Fig. 3. U.S. earthquakes with Richter magnitude 6.0 and above. Data from
National Earthquake Information Center (http://www.neic.cr.usgs.gov).
Earthquakes have also been roughly consistent in both frequency and energy
release. Figure 3 shows the number of earthquakes in the United States
greater than magnitude 6.0. As expected, there are approximately ten times
as many magnitude 6 to 7 earthquakes as there are earthquakes greater than
magnitude 7. Although there may be some minor variations, there is no
obvious increase in either occurrence or severity to coincide with the
recorded increase in costs.
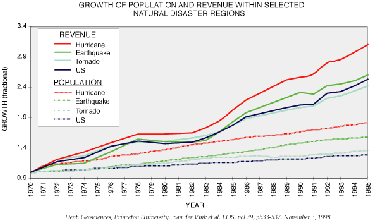
Fig.4. Fractional growth (relative to 1970) of population and revenue
in
disaster-prone areas of the United States [U.S. Census Bureau, 1997b].
As seen in Figure 4, the fractional growth (relative to 1970) of population
and revenue has increased markedly in disaster-prone areas of the nation.
States most affected by the costs of hurricanes (Florida, Maryland, North
Carolina, and Texas) and earthquakes (California and Washington) show the
largest increase in both population and revenue. More people are moving
into coastal areas that are vulnerable to natural hazards -- particularly
earthquakes on the west coast and hurricanes on the east coast.
Furthermore, the effect is amplified because the people who are moving into
these coastal areas represent the higher wealth segment of our society,
plus their wealth has been increasing.
Total cost estimates for natural disasters are highly speculative and
depend on (1) what financial consequences are included in the assessment,
(2) what phenomena are considered to constitute natural disasters, and (3)
the sporadic occurrence of large events such as Hurricane Andrew in 1992,
the 1993 Midwest floods, and the 1994 Northridge earthquake. In addition,
costs are absorbed through a spectrum of financial vehicles ranging from
insurance, federal programs, and disaster relief bills to tax deductions,
higher prices, and personal loss. Because of all these uncertainties, we
have used the direct costs of structural replacement and repair to compare
yearly totals and identify trends. Although such direct costs are less
than one half the total, they appear proportional and provide a consistent
measure.

Over the last decade, improvements in forecasting, warning systems, and
building codes have greatly reduced the number of fatalities from natural
disasters. As shown in Figure 1, however, economic losses have increased
several fold. Our mitigation efforts have succeeded in reducing the loss
of life from natural disasters, but not their costs.
Frequency and Severity of Events
The rise in sea level, global climate change, and weather patterns
associated with such phenomena as the El Nino[tilde over 2nd n throughout]
Southern Oscillation are all processes that influence the impact and
occurrence of hurricanes, floods, and tornadoes. Changes in plate motion
and strain accumulation can similarly alter the pattern of earthquakes.
Could an explanation for the increase in costs of natural disasters be a
corresponding increase in the frequency or severity of natural events, or
both?


There has been a slight increase in the frequency of tornado sightings
based on National Severe Storms Laboratory data
(http://www.nssl.noaa.gov/~spc/archive/tornadoes/index.html). The increase
coincides, however, with the implementation of a national Doppler radar
system and is therefore considered to reflect more accurate reporting
rather than a meaningful increase in occurrence.
Placing More Property in Harm's Way
Increase in natural disaster costs appear to correlate with changes in
population and wealth as measured by revenue. Revenue is an indicator of
wealth for the region. It is the total common tax revenue in the state,
excluding items that are inconsistent among states such as lottery taxes.

The costs of tornadoes are increasing at the slowest rate.
Correspondingly, the population in areas most prone to tornadoes (the
mid-west) is growing at the slowest rate, and the wealth in those regions
is increasing at the slowest rate. The fractional growth for the United
States as a whole is consistent with the trend in costs for floods. For
the purpose of Figure 4, we consider the U.S. trend to represent that of
flood regions, as floods occur throughout the country.
Developing a More Resilient Society
Although global phenomena such as climate change, sea level rise, and the
El Nino Southern Oscillation amplify the impact of certain disasters, such
as hurricanes, floods, and tornadoes, they do not explain the large
increase in U.S. costs over the last decade. We are becoming more
vulnerable to natural disasters because of the trends of our society rather
than those of nature. In other words, we are placing more property in
harm's way.
In many ways, the trends seem paradoxical. After all, most natural
disasters occur in areas of known high risk such as barrier islands, flood
plains, and fault zones. Over time, one would expect that the costs of
natural disasters would create economic pressures to encourage responsible
land use in such areas.
The long-term economic impact of low-probability, high-cost events such as
earthquakes and hurricanes are not being incorporated into the planning and
development of our societal infrastructure. Economic incentives for
responsible land use have been stifled by legislated insurance rates and
federal aid programs that effectively subsidize development in hazard-prone
areas. And while there will always be great political pressure to provide
economic relief after a disaster, there has been little political interest
in requiring predisaster mitigation.
To create political and economic pressures that are supportive of
responsible land-use, we need to begin with accurate projections of hazard
vulnerability. Such projections will require the integration and
assessment of data in many different formats, and expertise that cuts
across organizational, professional, and disciplinary boundaries. With an
improved understanding of hazard vulnerability, we can create (1) public
awareness that most natural disasters are not random acts, but rather the
direct and predictable consequence of inappropriate land use, and (2) broad
recognition of the enormous long-term costs to the general taxpayer for
inappropriate land use. If we can develop a society more resilient to
earthquakes, hurricanes, and floods, perhaps then we will learn to view
such events not as random acts that destroy our property and threaten our
lives, but rather as the natural processes that build our landscape and
shape our environment.
Acknowledgments
We thank the National Science and Technology Council's Subcommittee on
Natural Disaster Reduction for their comments on these findings, and Ross
Stein and David Simpson for their helpful reviews of the manuscript. This
work is the result of a class project that was supported by Princeton
University's Science and Technology Council and Department of Geosciences.
G. van der Vink is also at the IRIS Consortium, Washington, D.C.
References
Bermuda Biological Station for Research, "Tropical Cyclones and Climate
Variability, A Research Agenda for the Next Century," Risk Predication
Initiative, 1997.
Council of Economic Advisors, 1994 Economic Report of the President,
Government Printing Office, Washington, D.C., 1994.
National Science and Technology Council, Committee on Environment and
Natural Resources, Fact Sheet, Natural Disaster Reduction Research
Initiative, July 1997.
U.S. Census Bureau, Statistical Abstracts of the United States, Department
of Commerce, Washington, D.C., 1997a.
U.S. Census Bureau, Book of States, Department of Commerce, Washington,
D.C., 1997b.
Download pdf reprint of the complete article
(6.6Mb).
