
| Home |
| Research |
| Downloads |
| Publications |
| Teaching |
| People |
| Press |
| Allen CV |
| Seismo Lab |
| Earth & Planetary |
| UC Berkeley |

Plumbing in Iceland: Imaging Plate Formation in the Earth's Interior
The volcanoes of Iceland have long been a source of fascination for writers and scientists. Jules Verne started his "Journey to the Center of the Earth" at one, Snaefell. Old tales tell of the belief that the souls of the condemned traveled through another, Helka, on their way to hell due to its similarity to Dante's depiction of the gates to hell. Just as Iceland's unusual landscape has inspired authors, it has also drawn Earth scientists making Iceland one of the most intensely studied places on Earth.
Guust Nolet and Jason Morgan *64, Faculty, working with graduate student Richard Allen *01 have recently completed a study imaging the Earth's interior beneath Iceland. The aim of the study was to better understand the processes responsible for Iceland's very existence. The result is an image of a vast plumbing system feeding hot and molten rock from a deep mantle plume up through the crust into volcanoes and rift zones on the surface (figure 1) and providing new evidence in support of the plume hypothesis.

Figure 1. The Krafla rift zone in eruption. Photo by Allan Rubin.
The view from a plane on final approach to Iceland's international airport is enough to explain the attraction of Iceland to those interested in solid Earth processes. The recently erupted black rock surface, which extends across the Reykjanes Peninsula, is broken by the parallel knife cuts of faults resulting from the separation of Europe and America. It is only a short drive from the airport to volcanoes, glaciers, hot springs, geysers (figure 2) and Geysir � the geyser after which all others are named � and thundering waterfalls (see http://www.icetourist.is for a virtual tour). Further inland the landscape is barren, often flat with no vegetation, covered by lava flows and ash. In fact, it is so moon-like that Neil Armstrong and the other Apollo astronauts spent time training here before their trip to the Moon.
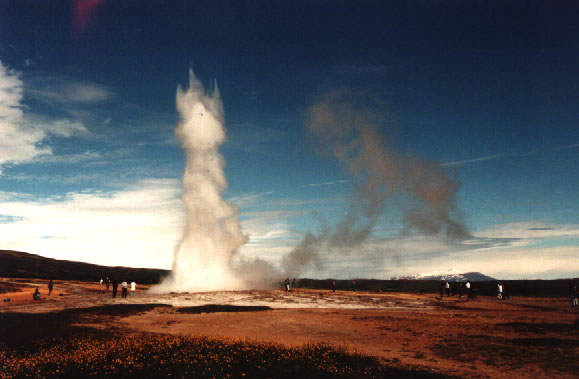
Figure 2. The Strokkur geyser. Photo by Richard Allen.
Iceland remains just as fascinating in the context of larger scale global processes. Figure 3 is a perspective view of the North Atlantic bathymetry. To the east and west the tops of continental shelves are seen in red above the deep ocean basin. Down the center of the basin the ocean floor shallows due to the buoyancy of hot new plate freshly formed along the Mid-Atlantic Ridge. The existence of Iceland is due to a huge swell in the ocean floor causing it to rise above sea level exposing the plate-forming processes, which usually take place 2.5 km beneath the waves.
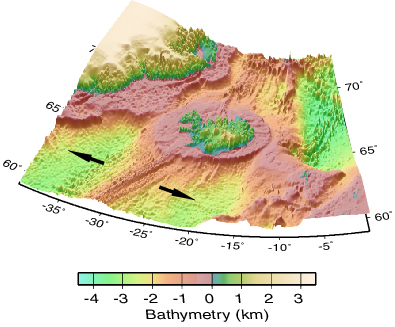
Figure 3. Bathymetry of the North Atlantic. Iceland (shown in the center) protrudes from the ocean basin sitting on a large swell shown in red. The red regions to the east and west are the European and Greenland continental shelves marking the edges of the ocean basin, which is up to ~3 km deep in the North Atlantic. It shallows in the center where hot new plate is formed. The plates move apart as shown by the arrows.
The unusual bathymetry, gravity anomalies and volcanic activity of Iceland and other oceanic islands, such as Hawaii, led Morgan to propose his mantle plume hypothesis in 1971. The plume model is an explanation for the chains of volcanic islands found across the floor of ocean basins parallel to plate motion. The observation calls for a stationary heat source beneath the oceanic lithosphere as a plate passes by. The model suggests that a thermally buoyant plume anchored in the lower mantle and rising to the surface provides the necessary continual stream of hot material.
In the summer of 1996, Nolet, Morgan and Allen went to Iceland as part of a team of American, Icelandic and British scientists for the deployment of the HOTSPOT project. Thirty seismometers on loan from the IRIS-PASSCAL instrument pool, funded by the NSF, were positioned in Iceland to record ground motion continuously for two years. The instrument locations are shown as circles in figure 4. Most of the data used came from these stations; however, two additional networks were also used. The permanent SIL (Southern Iceland Lowland) network (triangles in Figure 4), which is operated by the Icelandic Meteorological Office to monitor seismic hazard in populated regions, and the ICEMELT network (squares). Figure 4 also shows some of the geology of Iceland. The wide gray areas are fissure swarms, the product of the Mid-Atlantic Ridge crossing Iceland. All along them are volcanoes represented as black rings. The six most active volcanoes on Iceland are shown in red.
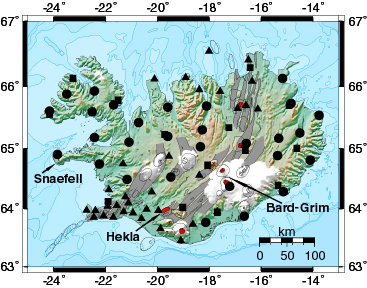
Figure 4. Map of Iceland showing the seismic stations used, topography and geology. The stations are shown in black, most data comes from the HOTSPOT network (circles). Data was also used from the SIL (triangles) and ICEMELT (squares) stations. The wide gray regions are fissure swarms representing the Mid-Atlantic Ridge on Iceland currently undergoing extension. Glaciers are white and active volcanoes are red.
The seismometers recorded thousands of earthquakes from both Iceland and around the world, providing a data set that can be used to determine the internal structure of the Earth. The technique used - seismic tomography - is similar to a CAT scan where x-rays are shot through the body at many different angles and recorded by many detectors on the other side of the body. Seismic tomography uses the energy from earthquakes around the world, which travels through the Earth and is recorded by many stations with seismometers installed on the surface. Variations in the velocity at which seismic energy travels through different rock causes the earthquake signal to arrive at slightly different times at the different seismic stations. By measuring these differences it is possible to construct a three dimensional map of seismic velocity in the Earth's interior, but only over a volume to a depth about equal to the horizontal extent of the seismic array. These variations in velocity are then interpreted in terms of rock properties. While many properties affect the velocity, temperature and presence of melt droplets have the most significant effect, both high temperatures and melt cause low velocities.
Nolet, Morgan, Allen and their co-workers from England and Iceland used recordings from over 300 earthquakes recorded at 78 stations to construct their images of velocity variations beneath Iceland. What was different about their study is the shear volume of data used and the variety of tomographic techniques used to construct the images. They combined the use of surface waves, which travel horizontally, with body waves that are predominantly vertical beneath Iceland. The criss-crossing nature of the energy from these different waves allowed resolution of both the near surface crustal structure (upper 50 km of the Earth) and the deeper mantle structure (down to ~400 km depth), something which has not been possible previously.
The result is visualization of a vast plumbing system as shown in figure 5, which is a vertical cross-section through the crust and mantle beneath Iceland. The largest scale processes are seen in the mantle portion of the image. From 400 km depth up to 200 km there is a vertical low velocity zone which is cylindrical in three dimensions. They interpret this as being a plume conduit, the low velocities being due to high temperature rock, which is thermally buoyant and flows up towards the surface. When it reaches the surface it is forced to flow horizontally outwards forming a plume head. This is also clear in figure 5c above 200 km depth. The plume head had not been observed previously; but it is visible in their study because they combine surface wave and body wave data.
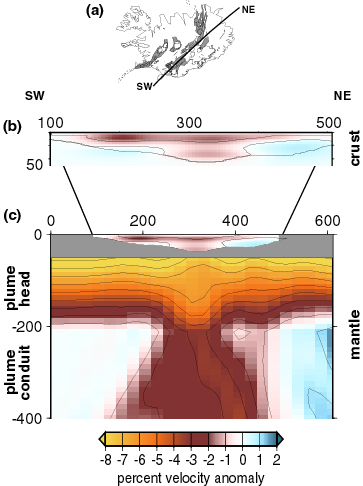
Figure 5. Vertical cross-sections through the crust and mantle models. (a) Map of Iceland showing the location of the cross-sections. (b) Crustal cross-section (enlarged relative to c). The low velocities (red) extend vertically through the lower crust up into the upper crust where they extend along the rift. (c) Cross-section through the crust and mantle illustrating the plume conduit from 400 km to 200 km, the plume head above 200 km, and the thickest crust above the center of the mantle plume.
The effect of the plume on plate formation processes is clear in the crustal thickness variations in Iceland. Figure 6 is a map of crustal thickness derived from surface waves using earthquakes in Iceland during the HOTSPOT experiment. The thickness of oceanic crust is remarkably constant around the world (6 +/- 1 km). In Iceland, however, the thinnest crust is ~15 km thick, the thickest - found in central Iceland above the center of the mantle plume - is 46 km thick.
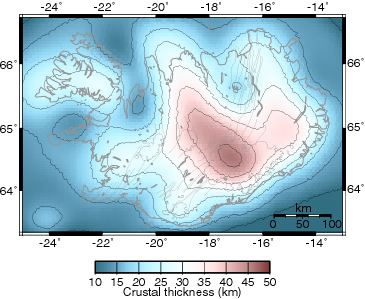
Figure 6. Crustal thickness across Iceland. The thickest crust (46 km) is in central Iceland above the core of the mantle plume today. It is the thickest because the plume is more active today than it has been over the last 20 million years.
The mantle plume connects to crustal pipes which feed melt from the plume up into the crust. This is shown in Figure 5c. The crustal velocity variations are superimposed on the mantle model. The mantle immediately beneath the crust down to 50 km has been grayed out so the variations in crustal thickness are visible. The crustal velocity variations are shown enlarged in figure 5b. The thickest crust is directly above the center of the mantle plume, beneath central Iceland (see location of cross-section on insert map), and is also associated with low velocities in the lower crust.
A vertical cylinder of low velocity extends through the lower crust up beneath the Bardarbunga-Grimsfjall Volcanic Complex, which is the most active volcanic complex in Iceland, most recently erupting in 1996 and 1998. This observation leads Nolet, Morgan and Allen to suggest that the low velocities are a thermal halo resulting from the passage of magma up to the volcanoes. What is surprising is that there are no such vertical pipes beneath any of the other active volcanoes in Iceland. Instead there is a horizontal low velocity zone in the upper crust which extends along the Mid-Atlantic Rift to the north and south of central Iceland (shown as the gray fissure swarms in figure 4). This suggests that magma is fed from the plume vertically up through the lower crust and into the upper crust where it is able to flow laterally along the rift to supply Iceland's other active volcanoes and the very process of plate formation.
Nolet, Morgan and Allen's visualization of the mantle plume beneath Iceland provides another piece of evidence in support of Morgan's plume hypothesis. The crustal plumbing, however, is new, previously unresolved in Iceland, although a similar structure was recently imaged beneath another part of the Mid-Atlantic Ridge on a smaller scale. Their interpretation of the crustal anomalies as magma plumbing will need further testing by the Earth science community. For example, a comparative geochemical study of Iceland's volcanoes could provide further clues.
This article was prepared by Richard Allen *01.