| Home |
| Research |
| Downloads |
| Publications |
| Teaching |
| People |
| Press |
| Allen CV |
| Seismo Lab |
| Earth & Planetary |
| UC Berkeley |

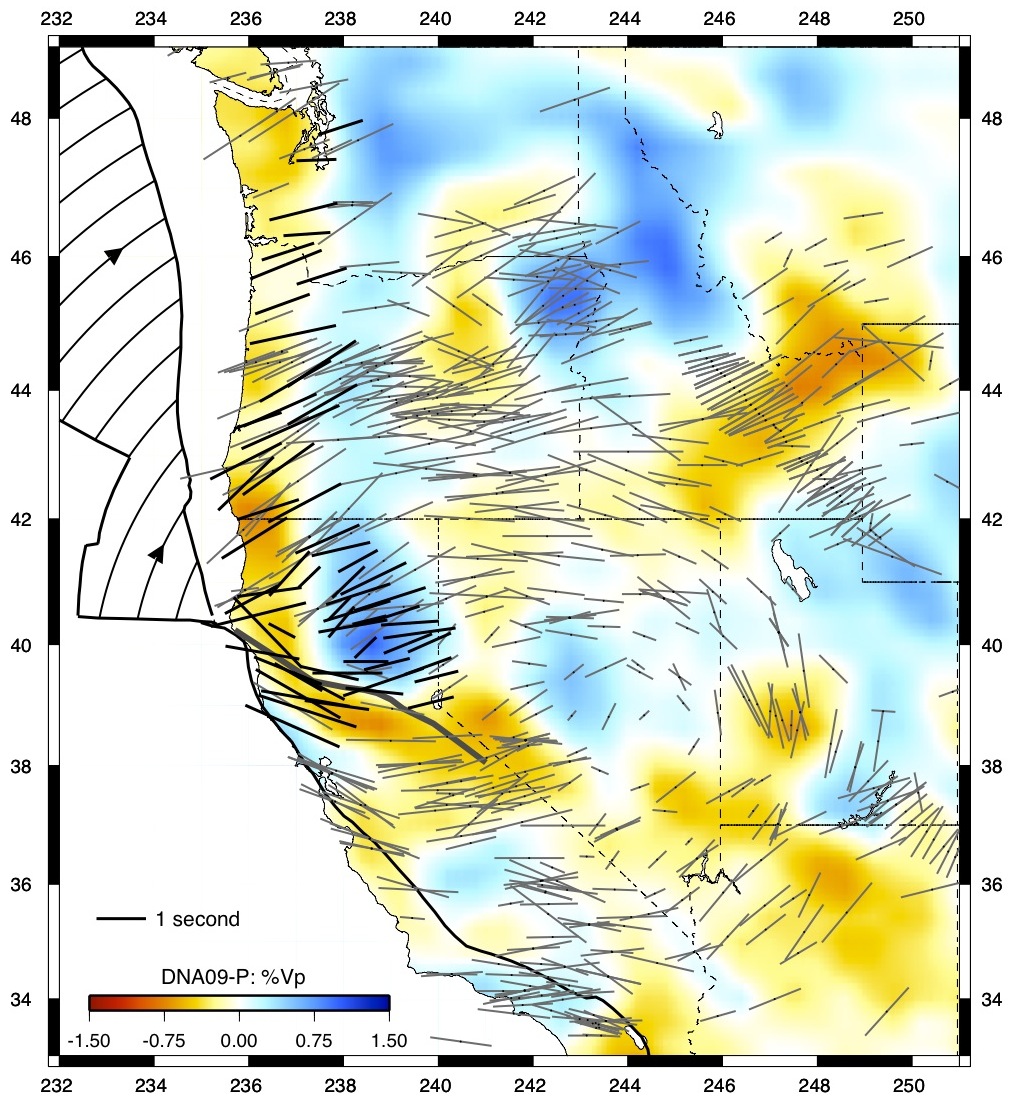
Fig. 2
Regional splitting pattern overlain on the vertically averaged upper mantle velocity anomaly. Our splitting results are shown in black and those of previous studies are in grey (Wang et al., 2008; Zandt and Humphreys, 2008; Long et al., 2009; West et al., 2009 and references therein). The splitting pattern is shown to be uniform trench-normal throughout Cascadia. The velocity anomaly shown is a vertical average of the velocity anomaly from the DNA09 P-wave model over the 100-400 km depth range (Obrebski et al., in press; http://dna.berkeley.edu). The slab is imaged as the north-south high velocity feature. The splitting measurements rotate around the southern end of the slab. Curved black lines on the G-JdF plate represent the direction of its absolute plate motion.
Back to abstract
Eakin, C.M., M. Obrebski, R.M. Allen, D.C. Boyarko, M.R. Brudzinski, R. Porritt
(2010)
Seismic anisotropy beneath Cascadia and the Mendocino triple junction: Interaction of the subducting slab with mantle flow,
Earth Planet. Sci. Lett. 297 627-632, doi:10.1016/j.epsl.2010.07.015
abstract |
reprint
© Richard M Allen