Episodic Slow Slip and Tremor (ETS) in Cascadia
Publications:
Wech, A. G., and N. M. Bartlow (2014), Slip rate and tremor genesis in Cascadia, Geophys. Res. Lett., 41, 392–398, doi:10.1002/2013GL058607.
Bartlow, N. M., S. Miyazaki, A. M. Bradley, and P. Segall (2011), Space-time correlation of slip and tremor during the 2009 Cascadia slow slip event, Geophys. Res. Lett., 38, L18309, doi:10.1029/2011GL048714.
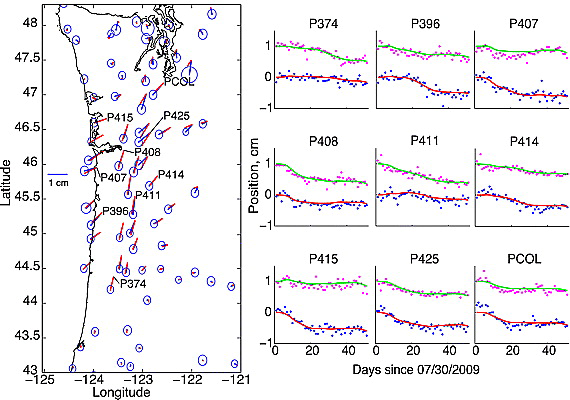 Figure 1: GPS data and NIF derived model fits for the 2009 Cascadia slow slip and tremor event. (left) Data and 1σ error ellipses shown in blue; model fit shown in red. Labeled stations refer to time series fits shown to the right. Offsets are not on the same scale as the map, see 1 cm scale bar. (right) Time series fits to GPS data for selected stations. Blue dots represent east displacements with model fit in red continuous line; pink dots represents north displacements with model fit in green. North component offset by 1 cm for clarity.
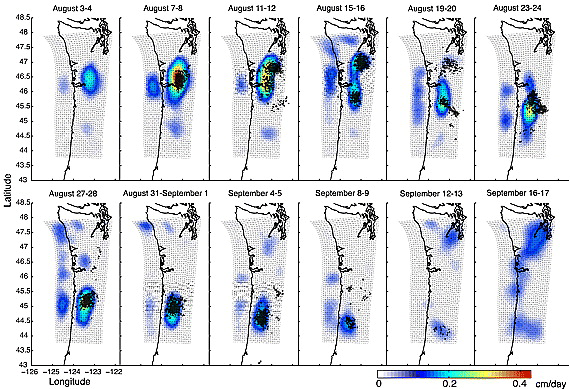 Figure 2: Slip rate on the plate interface, averaged over two day intervals. The tremor sources (black circles; determined from seismic data) and the GPS-derived slipping area (colors) are seen to track closely together. The plate interface mesh is shown between 10 and 60 km depth. Note that not all of the modeled days are shown.
 The Cascadia Subduction zone off the west coast of Northern California, Oregon, Washington, and Britich Columbia is where the Juan de Fuce tectonic plate collides with, and sinks below, the North American tectonic plate. Subduction zones host the largest earthquakes in the world, and the Cascadia subdiction zone in particular experienced an earthquake owith an estimated magnitude of 9.0 earthquake on January 26, 1700. The expected recurrance interval for large earthquakes in this region is 300-500 years.
In beween large earthquakes, the Cascadia subduction zone is not dormant. Rather, it's home to two recently discovered phenomena: slow slip events and tectonic tremor. In a slow slip event, the deeper extent of the interface between the two tectonic plates slips, as in an earthquake, but does so more slowly. While earthquake slip occurs over the course of seconds, slow slip occurs over the course of days to weeks. The vast majority of this slip is "silent", meaning it cannot be detected with seismic instruments. But, slow slip events in Cascadia do move the surface of the earth up to 1 cm, and this movement can be detected using GPS and other instruments (Figure 1). A small percentage of the slip during slow slip events is fast enough to generate seismic waves; this is called tectonic tremor. Tectonic tremor sources can be detected and located seismically. While slow slip and tremor are not dangerous to humans or the environment, they provide a window into the physics of subduction zones. Additionally, by characterizing and monitoring slow slip events, scientists may be able to detect changes leading up to a future large earthquake.
Dr. Bartlow has carried out GPS-data based studies of multiple Slow Slip events in Cascadia using the Network Inversion Filter (NIF) software package (see the software page). The actively slipping region during a slow slip event migrates along the subduction zone over the course of a few weeks, and this can be imaged by the NIF method. Dr. Bartlow showed that tectonic tremor sources and the actively slipping area track together (Fig. 2), implying that tectonic tremor sources are stuck patches within the slowly slipping region that are loaded to failure by the surrounding slip. This is illustrated schematically in Figure 3.
Together with collaborator Dr. Aaron Wech of the U.S. Geological survey, Dr. Bartlow identified the first known example of slow slip without tremor in the Cascadia subduction zone. This tremorless, truly "silent" slip occurred in a region with known tremor sources, but at a lower slip-rate than usual (Fig. 4). This implies a minimum slip-rate for tremor generation.
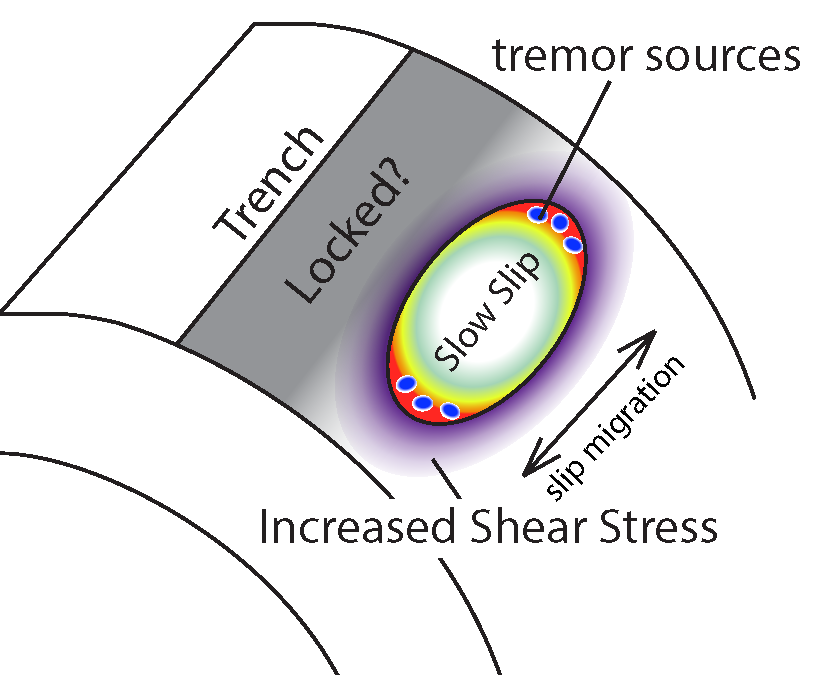 Figure 3: Schmatic of the relationship between slip and tremor. The area oh highest slip-rate (the actively slipping region) exists on one or both ends of an expanding slow slip patch. Stuck patches within this actively slipping region are loaded by the surrounding slip until they "pop off" as tremor sources.
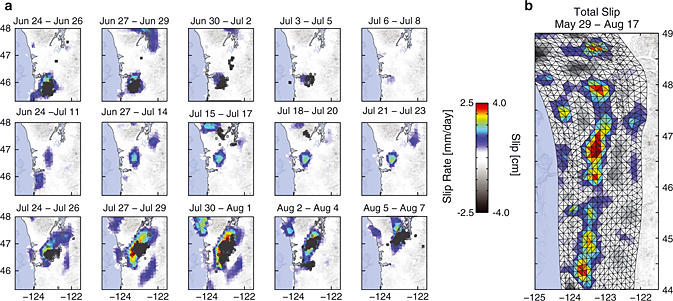 Figure 4: Slip rate snapshots and total slip distribution for the 2011 Cascadia slow slip and tremor event. (a) Three day snapshots around gap time window from 24 June to 8 August of slip rate (0 mm/day slip rate not plotted) and tremor (gray circles). (b) Resulting total slip from Network Inversion Filter. Colorbar represents slip rate for Figure 4a in mm/day and the total slip for Figure 4b in centimeter, respectively.
