Regional.vectorial.tomography.2
Lithospheric expression of geological units in central and eastern North America from full waveform tomography
Huaiyu Yuan [1], Scott French, Paul Cupillard, and Barbara Romanowicz [2]
(Email me your questions)
Contents |
Model Description
The 2014 model (SEMum_NA14) is an isotropic and radially anisotropic Vs model for the North American upper mantle, developed using 40 s regional waveforms and wavefield computations using the spectral element method (Yuan et al., EPSL, 402 176-186, 2014 link to the paper)
The horizontal extent of our model space is defined so as to contain the entire source station paths for all the regional distance data, which is necessary for modeling the corresponding waveforms using a regional spectral element code. See Figure below for the spatial limit.
We parameterize our model space using spherical splines (Wang and Dahlen, 1995), with varying nodal spacing according to the ray path coverage: the 1° nodes roughly correspond to the region covered by the TA sites and the nearest neighboring region, then 2° nodes fill up the rest of continent and margins up to the borders of the model space (Fig. S1). The node spacing is 4° in the region outside of the model space where the model parameters are fixed as in SEMum2 (French et al., 2013), which is used to correct for 3D path effects outside of the model region for the 60 s global and 60 s NA waveforms, and below 1000 km depth for the 40 s NA waveforms. The vertical parameterization comprises 26 B-splines, with a node spacing that varies from 20 km beneath the Moho to 150 km at 1000 km depth (Mégnin and Romanowicz, 2000).
In the continents, our smooth crust matches the Moho depth of Crust2.0 (Bassin et al., 2000), with slight smoothing to avoid aliasing in the SEM mesh, while Moho depth saturates at 30 km in oceanic regions.
During the background model in North America was iterated twice using the global data set, while the outside region remained the same as the SEMum2 model. The updated North American region was then further inverted using the hybrid Regsem and NACT approach with both the 60 and 40s regional waveforms. See the paper for the detail (link to paper)
.
The tomographic inversion results for Vs and ξ are presented in the EPSL paper link. Below you can find a link to download the model in Matlab format, as well as some scripts to plot the model.
Download the 2014 Model
Model in Matlab
The 3D model of the isotropic Vs, and radial anisotropy variations can be accessed here, in a form of MATLAB .mat files and supporting scripts.
Some examples are provided to construct 1D profiles at a point, 2D depth-cross sections, 2D map views and 3D volumes.
To make different profiles/maps/3D volumes than in the examples, change only the lat/lon/depth variables in the beginning of the scripts.
Go to the Download Page for the 3D model.
Research Highlights
•A continental Vs model is constructed by waveform tomography and USArray data.
•Pronounced correlation is found between fossil structure and seismic anomalies.
•A band of low velocities separates craton from accreted terranes.
•A Bermuda low velocity channel dominates in the NW Atlantic shallow mantle.
•Offshore accreted terranes are deep rooted and of proposed continental origin.
Figures
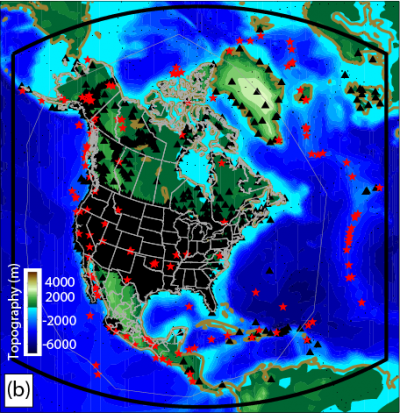
Figure stations (black triangles) events (red stars) and RegSEM model space (thick black line). Modified from Figure 1 of Yuan et al., 2014.
Note the model space for the RegSEM simulation is the region defined by the thick black line. For region for the Vs and Xi inversion is smaller, defined by the thin grey line.