Regional.vectorial.tomography.download
| |
Contents |
Download Instructions
1 The 3D isotropic Vs, radial anisotropy \xi, azimuthal anisotropy amplitude dlnG (%) and fast axis directions are stored in four MATLAB TriScatteredInterp interpolants Fs, Fx, Fg, and Faz. The interpolants were formed from the 3D model A3d files and good for a 3D volume from 10 to 80 lat, 181 to 320 long and 40 to 450 km at depth.
- Download the interpolants here (2MB .mat binary file). Load it up in Matlab.
- The following examples show how to draw 1D profiles, 2D cross sections and maps, and a 3D volume.
- Note the 3D model was laterally confined to the region defined by this file. Interpreting results close to the edge is not recommended.
2 To run the scripts, make sure the interpolants are first loaded up in matlab: load F.interpolant.NA.mat. Then run the scripts below.
3 For your own profiles/maps, change only the locations in latlon and depths in each script.
4 Files needed are put here for easy downloading:
- Email me if there are any questions.
- Back to Regional Vectorial Tomography page.
| |
Examples
1D profiles
The MATLAB script is listed below. You can download it File:Plot NA 1D.m.txt.
Rename it back to .m, and run it in matlab. The output looks like this .For your own profiles, you need to change the station location (in latlon) to make a new plot. The profiles are stored in ps/px/pg/pax which have the same vector length as depth (zii), in case you want to plot them on your own.
%plot 1D profiles

clear;close;
latlon=[62.5600 -114.6100]; %YKW3 station
zii=[40:5:450];

if exist('Fs','var')
else
load F.interpolant.NA.mat
end;


%longitude 0 to 360
latlon(2)=mod(latlon(2),360);

%vs
ps=Fs(latlon(1)*ones(size(zii)),latlon(2)*ones(size(zii)),zii);

subplot(141);
plot(ps,zii);set(gca,'ydir','reverse','tickdir','out');
ylim([40 450]);axis tight;
xlabel('Vs (m/s)');ylabel('Depth (km)');


%xi
px=Fx(latlon(1)*ones(size(zii)),latlon(2)*ones(size(zii)),zii);

subplot(142);
plot(px,zii);set(gca,'ydir','reverse','tickdir','out');
ylim([40 450]);axis tight;
xlabel('\xi ');ylabel([]);

%g
pg=Fg(latlon(1)*ones(size(zii)),latlon(2)*ones(size(zii)),zii);

subplot(143);
plot(pg,zii);set(gca,'ydir','reverse','tickdir','out');
ylim([40 450]);axis tight;
xlabel('dlnG (%) ');ylabel([]);

%
paz=Faz(latlon(1)*ones(size(zii)),latlon(2)*ones(size(zii)),zii);


subplot(144);
plot(paz,zii);set(gca,'ydir','reverse','tickdir','out');
ylim([40 450]);axis tight;
xlabel('Fast Axis (\circ) ');ylabel([]);
| |
2D depth cross-sections
The MATLAB script is listed below. You can download it File:Plot NA 2D.m.txt.
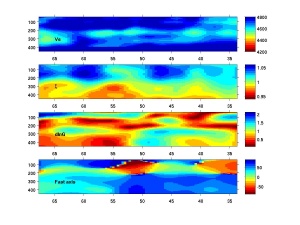
Rename it back to .m, and run it in matlab. The output looks like this .For your own profiles, you need to change the location of the profile (latlon) to make a new plot. The profiles are stored in ps/px/pg/pax which have the same vector length as depth (zii), in case you want to plot them on your own.
%plotting depth cross-sections.


%%
%depth cross-section along a great circle path.

%specify starting/ending points (lat1,lon1,lat2,lon2) and # of points in
%between
latlon=gcwaypts(67.5,-122.55,34,-85,83);%nearly North-south profile
%specify depth vectory
zii=[40:5:450];

%the profiles are stored in ps, px, pg and paz which have the dimension as
%length(latlon) by length(zii0).

%no need to change lines blow.

%%
if exist('Fs','var')
else
    load F.interpolant.NA.mat
end;

latlon(:,2)=mod(latlon(:,2),360);
dis0=distance(latlon(1,1),latlon(1,2),latlon(:,1),latlon(:,2));
nz=length(zii);
nx=length(latlon);

%for nx*nz by 3 vector for interpolation
latloni=zeros(nx*nz,3);
for i=1:nz,
    latloni((i-1)*nx+1:i*nx,:)=[latlon ones(nx,1)*zii(i)];
end;
%
clf;colormap(flipud(jet(16)));
%az

%these lines illustrate how to get the values along the profile. The
%interpolation takes some time.
paz=Faz(latloni(:,1),latloni(:,2),latloni(:,3));
paz=reshape(paz,nx,nz);
px=Fx(latloni(:,1),latloni(:,2),latloni(:,3));
px=reshape(px,nx,nz);
pg=Fg(latloni(:,1),latloni(:,2),latloni(:,3));
pg=reshape(pg,nx,nz);
ps=Fs(latloni(:,1),latloni(:,2),latloni(:,3));
ps=reshape(ps,nx,nz);

%%
%plotting. Note the example profile goes nearly north-south so latitude is
%used as the x axis. You can use dis0 here too.
%
subplot(4,1,4);%anisotropy direction
imagesc(latlon(:,1),zii,paz');
set(gca,'xdir','reverse');colorbar('vert');ylim([40 450]);
xtick0=get(gca,'xtick');
ht(4)=text(xtick0(end),300,'Fast axis'); %note this line may not work for all cases.
%xi
subplot(4,1,2);%radial anisotorpy
imagesc(latlon(:,1),zii,px');
caxis([.94 1.06])
set(gca,'xdir','reverse');colorbar('vert');ylim([40 450]);
ht(2)=text(xtick0(end),300,'\xi'); %note this line may not work for all cases.

%xi
subplot(4,1,3);%azimuthal anisotropy strength
imagesc(latlon(:,1),zii,pg');
set(gca,'xdir','reverse');colorbar('vert');ylim([40 450]);
ht(3)=text(xtick0(end),300,'dlnG'); %note this line may not work for all cases.

%dlnvs
subplot(4,1,1);%vs
imagesc(latlon(:,1),zii,ps');caxis([4200 4800]);
set(gca,'xdir','reverse');colorbar('vert');ylim([40 450]);
set(findobj(gcf,'type','axes'),'tickdir','out');
ht(1)=text(xtick0(end),300,'Vs'); %note this line may not work for all cases.


set(ht,'color','k','fontweight','bold');%again this may not work
| |
Map View
The MATLAB script is listed below. You can download it File:Plot NA map.m.txt.
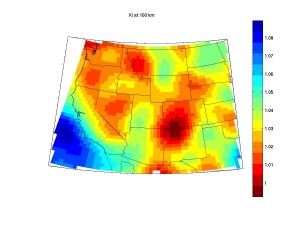
Rename it back to .m, and run it in matlab. The output looks like this .For your own map, you need to change di, xii, and yii in the sciprt. The example map is in vsi.
%maps. note in plotting Matlab mapping toolbox is used.
%specify lat/lon range and depth
di=0.5;%lat/lon interval
[xii yii]=ndgrid([30:di:50],[-125:di:-95]);
z0=100; %depth at 100 km;


%
yii=mod(yii,360);
zii=ones(size(xii)).*z0;


vsi=Fs(xii,yii,zii); %Fs/Fg/Faz too

%using mapping tool box
origin = [40 -110];
flatlimit = [-10 10];
flonlimit = [-12.5 10];
clf;
ax = worldmap('USA');
set(gca, 'Visible', 'off')
setm(gca,'origin',origin,'flatlimit',flatlimit,'flonlimit',flonlimit, ...
    'plinelocation',[10],'mlinelocation',[10])
coast=load('coast');
plotm(coast.lat,coast.long,'k');
states = shaperead('usastatelo', 'UseGeoCoords', true);

hf=framem;set(hf,'linewidth',.5,'visible','on');
geoshow( states,'FaceColor','none','edgecolor','k');


hg=geoshow(vsi,[1/di 50 -125],'displaytype','texturemap');
hb=colorbar('vert');
| |
3D volume
The MATLAB script is listed below. You can download it File:Plot NA 3D.m.txt.
Rename it back to .m, and run it in matlab. The output looks like this .For your own 3D volume, you need to change xii, yii and zii to get the new volume.
%3D volume. This is expanded from the maps.
%Note in plotting Matlab mapping toolbox is used.
%specify lat/lon range and depth
di=0.5;%lat/lon interval
z0=[50:10:300]; %depth at 100 km;

[xii yii zii]=ndgrid([30:di:50],[-125:di:-95],z0);


%
yii=mod(yii,360);


vsi=Fs(xii,yii,zii); %Fs/Fg/Faz too
%3D volume is now in vsi

%plotting: plot depth at 100 km.
ipz=find(z0==100);

%using mapping tool box
origin = [40 -110];
flatlimit = [-10 10];
flonlimit = [-12.5 10];
close all;
ax = worldmap('USA');
set(gca, 'Visible', 'off')
setm(gca,'origin',origin,'flatlimit',flatlimit,'flonlimit',flonlimit, ...
    'plinelocation',[10],'mlinelocation',[10])
coast=load('coast');
plotm(coast.lat,coast.long,'k');
states = shaperead('usastatelo', 'UseGeoCoords', true);

hf=framem;set(hf,'linewidth',.5,'visible','on');
geoshow( states,'FaceColor','none','edgecolor','k');


hg=geoshow(vsi(:,:,ipz),[1/di 50 -125],'displaytype','texturemap');
hb=colorbar('vert');


