HAST - UC Hastings Preserve, Carmel Valley, CA, USA
We operate broadband and borehole stations under the network code BK. The Berkeley Digital Seismic Network (BDSN) is a regional network of very broadband and strong motion seismic stations designed to monitor regional seismic activity as well as provide high quality data. The Berkeley borehole stations have borehole geophones or other seismic sensors and may have other geophysical instrumentation.
| Station Name | HAST |
| In Operation | 2006/02/02 00:00:00 - 2019/02/27 19:57:00 |
| Latitude | |
| Longitude: | |
| Elevation: | 542.0 meters |
| Instrumentation | Broadband |
Location
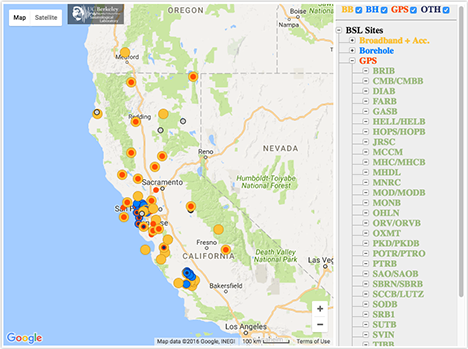
The site is located at the Hastings Biological Field Station of the University of California. Hastings is located in the Santa Lucia mountain range in Monterey County, California.This station is a collaboration among Hastings, the Berkeley Seismological Laboratory, and the USArray component of the Earthscope program. The station was installed by USArray personnel in July 2004. When the Travelling Array left California in 2007, the BSL adopted this station. It has been operating as a BDSN station since March 2008.
Network
Berkeley Digital Seismic Network (BK)Geology
Sandstone, shale, siltstone, conglomerate,and breccia
Borehole Conditions
The HAST installation is based on the USArray vault design.Station Pictures
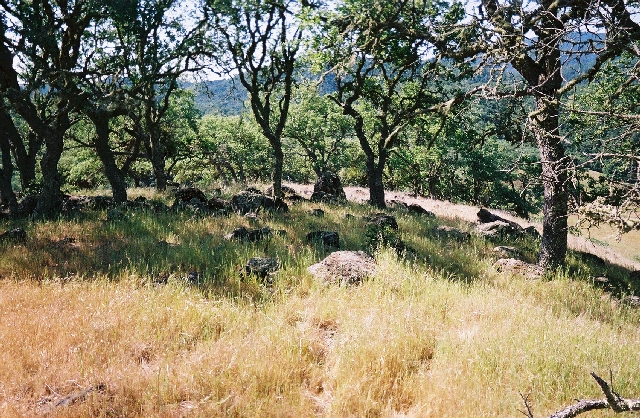
Oak Trees at Hastings |
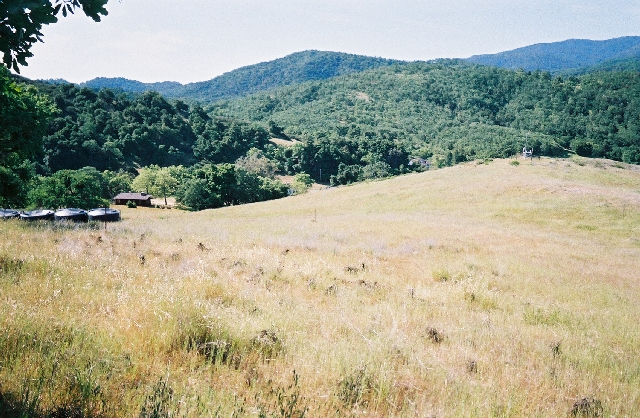
View toward weather station |
Table of Seismic Instrumentation
| Sensor | Datalogger | SEED Channels | Location | |
| Broadband | Streckeisen STS-2 VBB Tri-Axial Seismometer | Q330HR | BH?,HH?,LH?,VH? | 00 |
| Accelerometer | Kinemetrics FBA ES-T Accel. USGS (4 g max 5 v/g) | Q330HR | HN? | 00 |
| Auxiliary | AntennaCurrent | Q330HR | VE? | 00 |
| ClockPhase | Q330HR | LC?,VC? | 00 | |
| ClockQuality | Q330HR | LC?,VC? | 00 | |
| InputVoltage | Q330HR | VE? | 00 | |
| SystemCurrent | Q330HR | VE? | 00 | |
| SystemTemperature | Q330HR | VK? | 00 | |
| VCOValue | Q330HR | VC? | 00 |
Waveforms and associated metadata are available at the Northern California Earthquake Data Center (NCEDC).
Waveform Data
- BK Information Directory, including
- List of station locations
- List of available channels
- Instrument Response
- Querying the archives
- Download waveform data