JAS - Jamestown, CA, USA
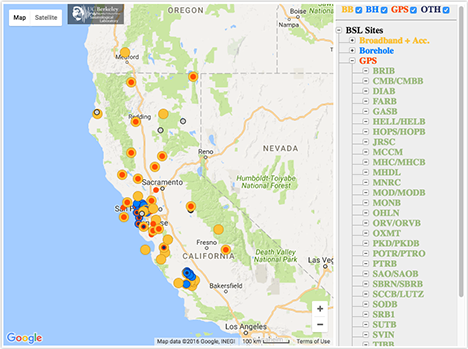
We operate broadband and borehole stations under the network code BK. The Berkeley Digital Seismic Network (BDSN) is a regional network of very broadband and strong motion seismic stations designed to monitor regional seismic activity as well as provide high quality data. The Berkeley borehole stations have borehole geophones or other seismic sensors and may have other geophysical instrumentation.
| Station Name | JAS |
| In Operation | 1980/10/01 00:00:00 - 1984/07/25 23:59:00 |
| Latitude | |
| Longitude: | |
| Elevation: | 428.1 meters |
| Instrumentation | Broadband |
Location
The site was located in Jamestown, California, and operated in cooperation with the California Department of Water Resources, beginning in 1964. This station was relocated to JAS1 when the rising price of gold in the mid-1980s led to renewed mining activity.JAS (and JAS1) were part of the USGS Digital World Wide Standard Seismograph Network (DWWSSN), the digital descendant of the WWSSN.
Network
Berkeley Digital Seismic Network (BK)Geology
Pre-Cretaceous metamorphic rocks
Borehole Conditions
Seismometers are located in an old gold mine on a concrete pad attached to bedrock.Station Pictures

No photos are currently available |
No photos are currently available |
Table of Seismic Instrumentation
| Sensor | Datalogger | SEED Channels | Location | |
| Broadband | Teledyde Geotech T210 LP V Seismometer | DWSSN | MH? | |
| Teledyne Geotech T200 LP H Seismometer | DWSSN | MH? | ||
| Geophone | Teledyne Geotech S13 SP V Seismometer | DWSSN | BH? |
Waveforms and associated metadata are available at the Northern California Earthquake Data Center (NCEDC).
Waveform Data
- BK Information Directory, including
- List of station locations
- List of available channels
- Instrument Response
- Querying the archives
- Download waveform data