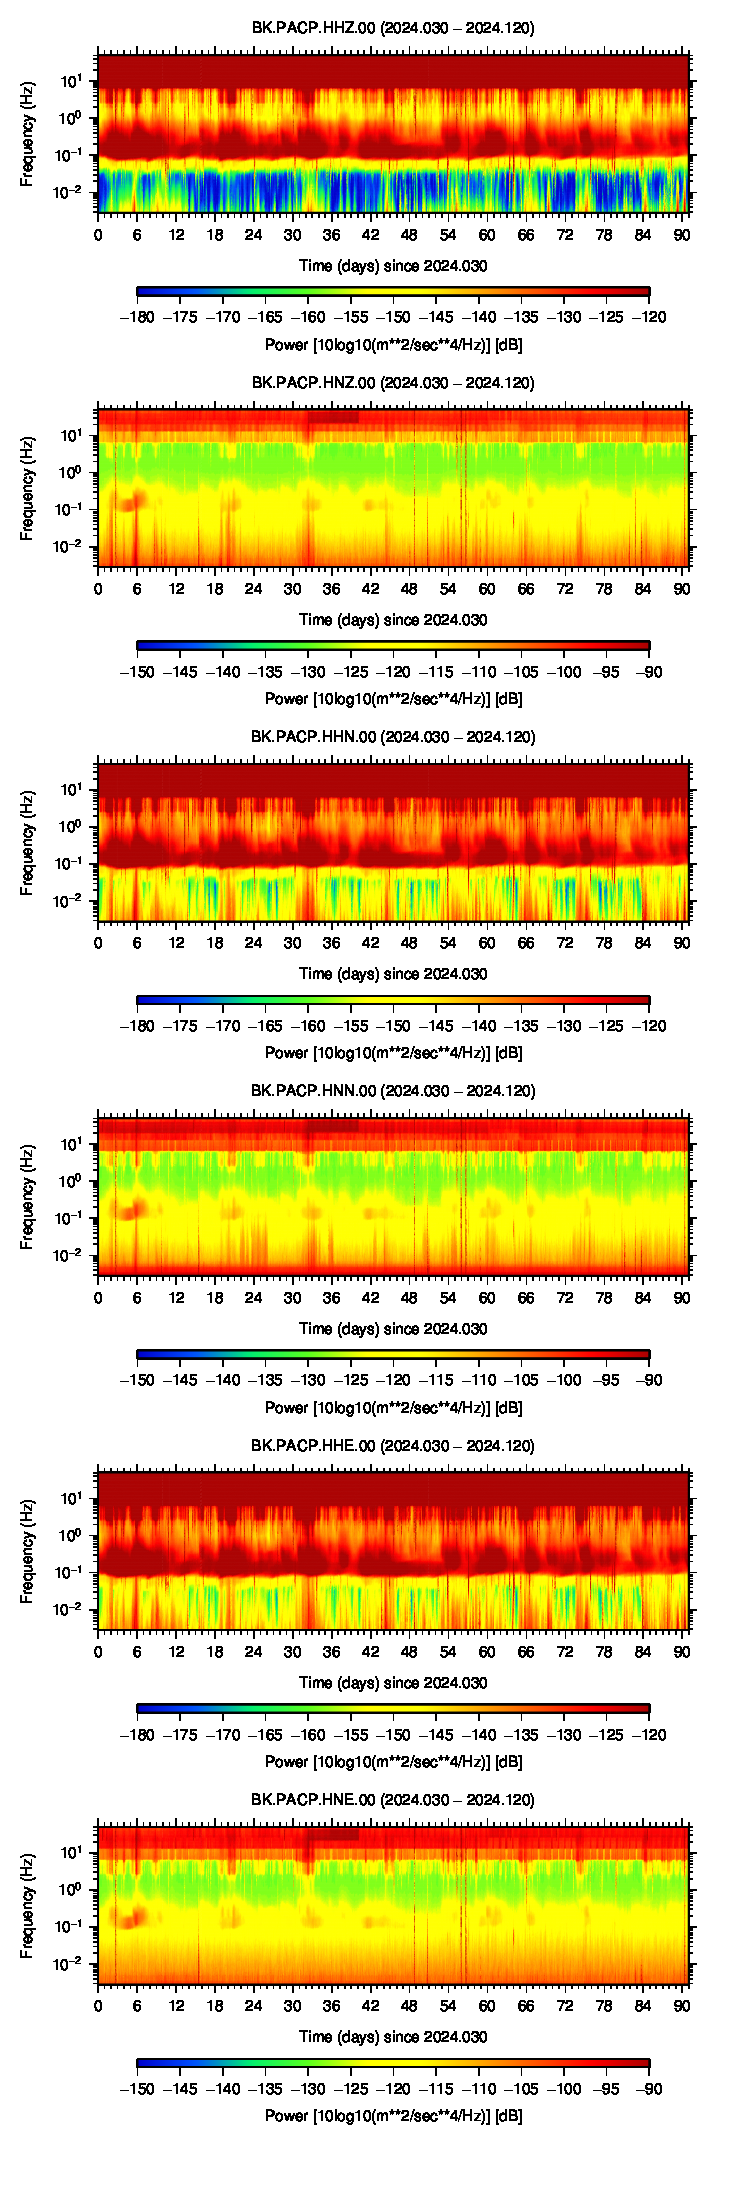
PACP - Pacheco Peak, CA, USA
We operate broadband and borehole stations under the network code BK. The Berkeley Digital Seismic Network (BDSN) is a regional network of very broadband and strong motion seismic stations designed to monitor regional seismic activity as well as provide high quality data. The Berkeley borehole stations have borehole geophones or other seismic sensors and may have other geophysical instrumentation.
| Station Name | PACP |
| In Operation | 2003/06/19 15:00:00 - Present |
| Latitude | |
| Longitude: | |
| Elevation: | 844.0 meters |
| Instrumentation | Broadband |
Location
PACP is installed at Pacheco Peak in south Santa Clara County. The site was established under the auspices of the CA Department of Forestry and Fire Protection and Santa Clara County. The mountain top site has two existing concrete radio vaults and 30 meter antenna towers. Police, fire, and state, and county communication equipment are housed there.Support for PACP was provided by the Governor's Office of Emergency Services as part of the California Integrated Seismic Network.
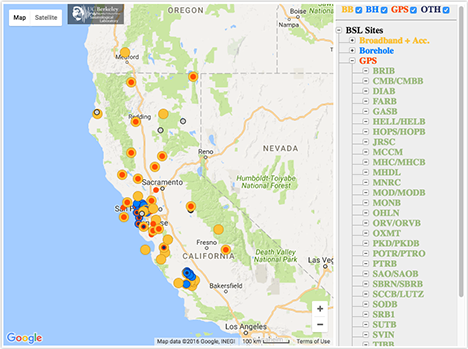
Network
Berkeley Digital Seismic Network (BK)Geology
Miocene Volcanic Andesite
Borehole Conditions
The PACP vault is a surface installation, constructed on bedrock outcrops on Pacheco Peak. The pier is surrounded by concrete bricks and 4" of insulation. The entire vault is then surrounded and topped by bags of concrete mix.Station Pictures
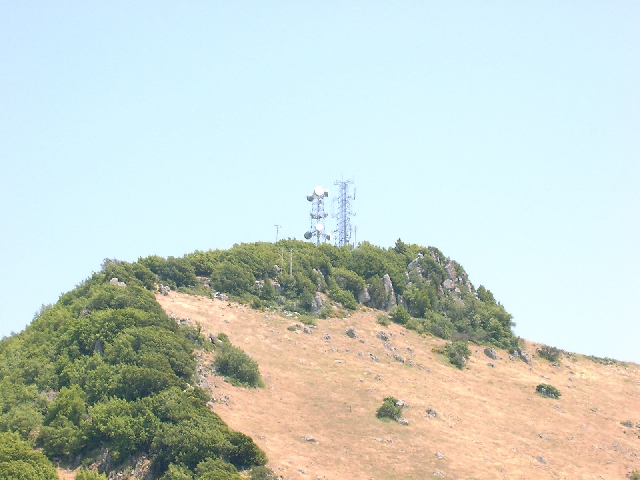
View of Pacheco Peak |
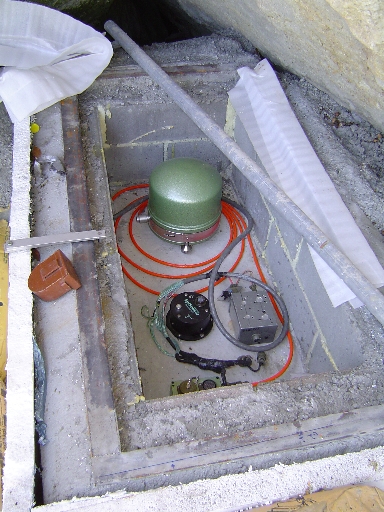
STS-2 & Episensor in PACP vault |
Table of Seismic Instrumentation
| Sensor | Datalogger | SEED Channels | Location | |
| Broadband | STS-2 | Q330HR | BH?,HH?,LH?,VH? | 00 |
| Accelerometer | EPISENSOR ES-T | Q330HR | HN? | 00 |
| Auxiliary | ANTENNACURRENT | Q330HR | VE? | 00 |
| CLOCKPHASE | Q330HR | LC?,VC? | 00 | |
| CLOCKQUALITY | Q330HR | LC?,VC? | 00 | |
| INPUTVOLTAGE | Q330HR | VE? | 00 | |
| SYSTEMCURRENT | Q330HR | VE? | 00 | |
| SYSTEMTEMPERATURE | Q330HR | VK? | 00 | |
| VCOVALUE | Q330HR | VC? | 00 |
Waveforms and associated metadata are available at the Northern California Earthquake Data Center (NCEDC).
Waveform Data
- BK Information Directory, including
- List of station locations
- List of available channels
- Instrument Response
- Querying the archives
- Download waveform data