SAO - San Andreas Geophysical Observatory
We operate broadband and borehole stations under the network code BK. The Berkeley Digital Seismic Network (BDSN) is a regional network of very broadband and strong motion seismic stations designed to monitor regional seismic activity as well as provide high quality data. The Berkeley borehole stations have borehole geophones or other seismic sensors and may have other geophysical instrumentation.
BARD is our GPS network for monitoring crustal deformation across the Pacific-North America plate boundary and in the San Francisco Bay Area for earthquake hazard reduction studies and rapid earthquake emergency response assessment
| Station Name | SAO (SAOB) |
| In Operation | 1988/01/28 00:00:00 - Present |
| Latitude | |
| Longitude: | |
| Elevation: | 359.8286 meters |
| Instrumentation | Broadband GPS Other |
Location
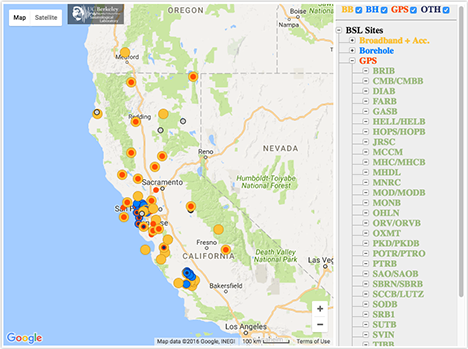
Site is located at the San Andreas Geophysical Observatory in the Hollister Hills State Vehicle Recreation Area. The BSL first occupied this site in 1966, with a variety of geophysical instrumentation. The digital broadband sensors were installed in 1988.SAO is a cooperative station with the Advanced National Seismic System.
Network
Berkeley Digital Seismic Network (BK)Bay Area Regional Deformation Network Network (BARD)
Geology
Jurassic-Cretaceous Gabilan Granite
Borehole Conditions
The vault is a buried steel culvert liner with a set of three isolation doors leading to the interior. The pier is poured concrete. The datalogger and supporting equipment are located in an air-conditioned structure approximately 50' away and connected via underground conduits. The seismometers are thermally insulated with 4" of polyurethane foam.GPS Monument Description
Poured concrete cylinder with steel reinforcement

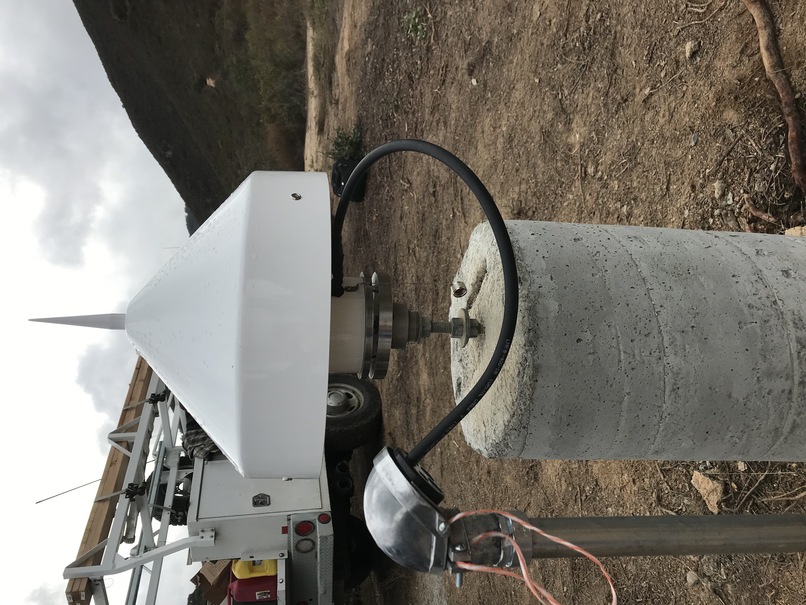

Table of Seismic Instrumentation
| Sensor | Datalogger | SEED Channels | Location | |
| Broadband | Streckeisen STS-1/E300 VBB Feedback Horizontal Seismometer | Q330HR-GFE | BH?,HH?,LH?,VH? | 00 |
| Streckeisen STS-1/E300 VBB Feedback Vertical Seismometer | Q330HR-GFE | BH?,HH?,LH?,VH? | 00 | |
| Accelerometer | Kinemetrics FBA ES-T Accel. GFE (4 g max 5 v/g) | Q330HR-GFE | HN? | 00 |
| Auxiliary | AntennaCurrent | Q330HR-GFE | VE? | 00 |
| ClockPhase | Q330HR-GFE | LC?,VC? | 00 | |
| ClockQuality | Q330HR-GFE | LC?,VC? | 00 | |
| InputVoltage | Q330HR-GFE | VE? | 00 | |
| SystemCurrent | Q330HR-GFE | VE? | 00 | |
| SystemTemperature | Q330HR-GFE | VK? | 00 | |
| VCOValue | Q330HR-GFE | VC? | 00 | |
| CalibrationInput | Q330HR-GFE | LC? | EP | |
| Humidity | Q330HR-GFE | LI? | EP | |
| Pressure | Q330HR-GFE | LD? | EP | |
| Setra Systems Model 270 Barometer | Q330HR-GFE | LD? | EP | |
| Temperature | Q330HR-GFE | LK? | EP |
GPS Instrumentation
| Receiver | Antenna | Radome | - | |
| GPS | SEPTENTRIO POLARX5 | SEPTENTRIO SEPCHOKE_B3E6 | SPKE | - |
Waveforms and associated metadata, and GPS data, are available at the Northern California Earthquake Data Center (NCEDC).
Waveform Data
- BK Information Directory, including
- List of station locations
- List of available channels
- Instrument Response
- Querying the archives
- Download waveform data
GPS Data
- Site log: saob.log
Data Type From To Low-rate raw 08/21/1997 6/9/2009 Low-rate rinex 08/21/1997 present High-rate raw 6/9/2009 present High-rate rinex 5/1/2010 present
Noise Analysis
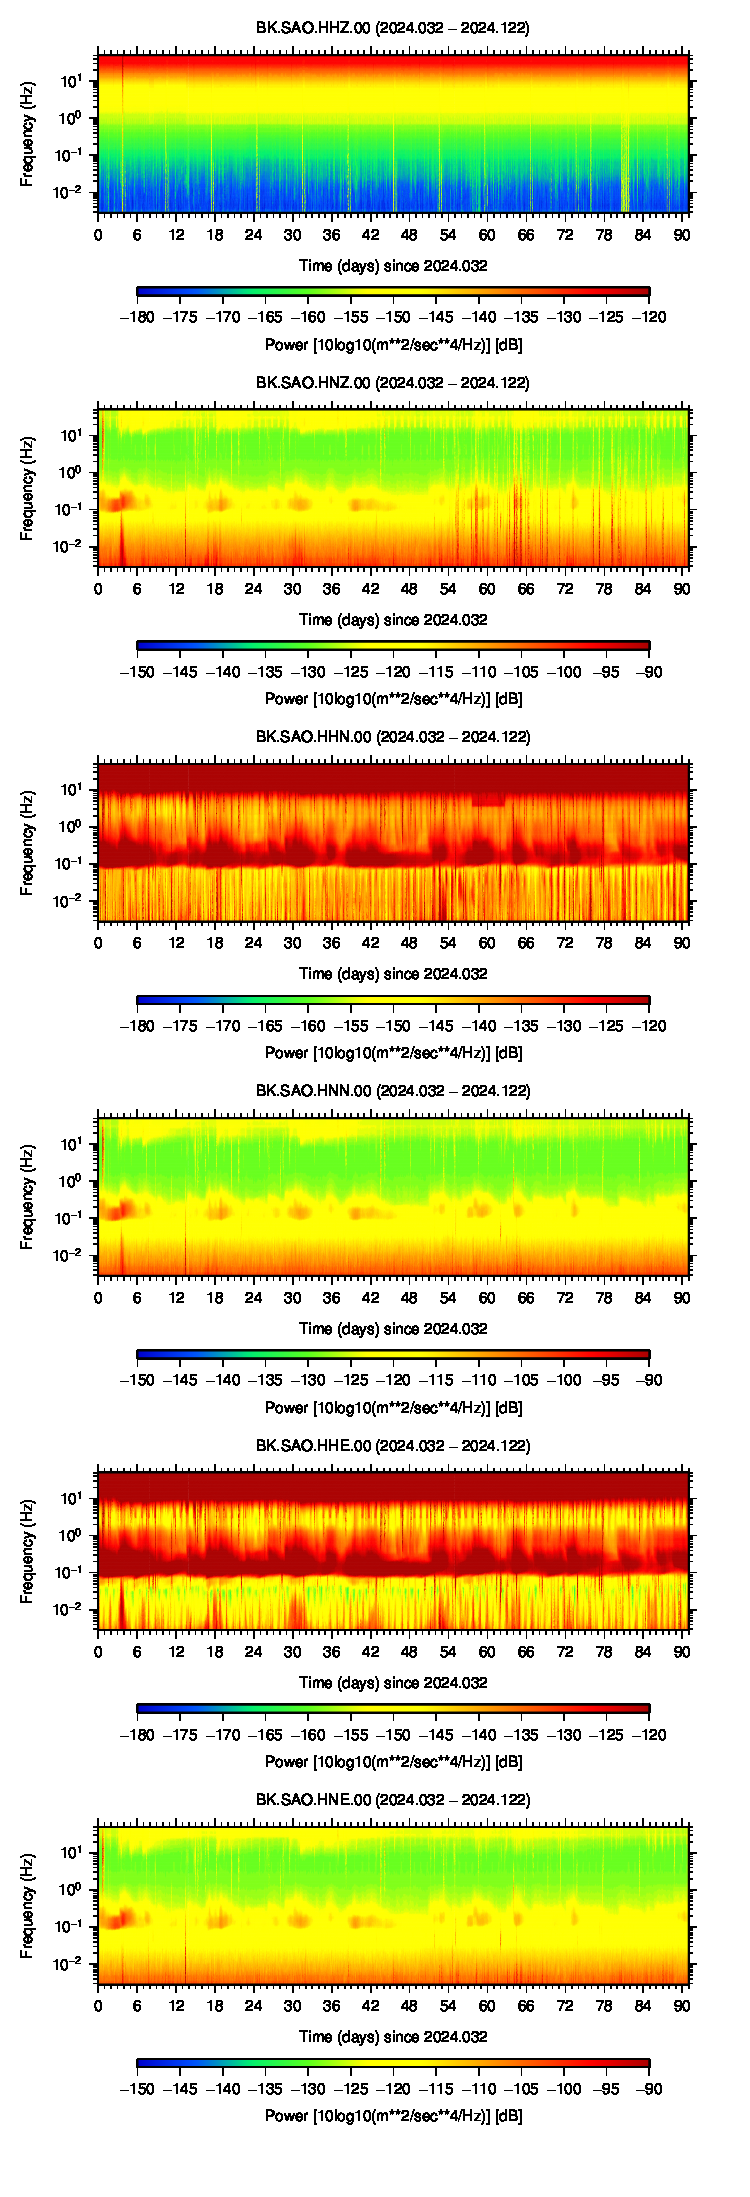 |
GPS Data Quality
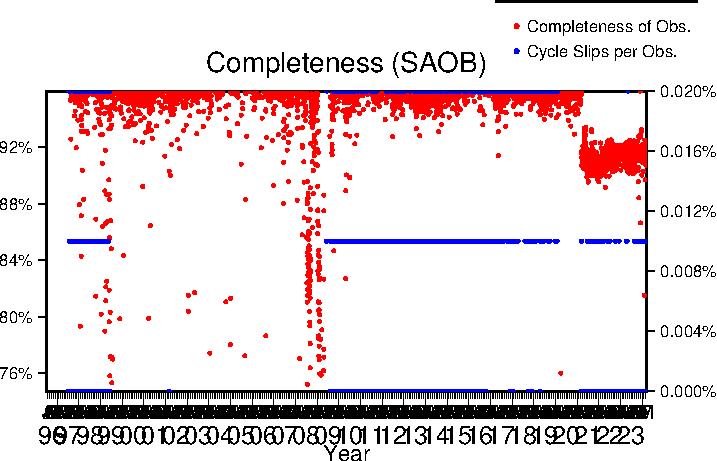
Completeness
Data completeness is defined both as "Completeness of observations" and "Cycle slips per observation". "Completeness of Obs." is the number of epochs in the final RINEX file normalized to the expected number. This percentage will go down if time is missing from the RINEX file. "Cycle slips per Obs." is the total number of detected cycle slip normalized to the total number of observations in the RINEX file. This number will increase as the receiver loses lock on satellites more frequently.
| Previous Year |
 |
| Lifetime |
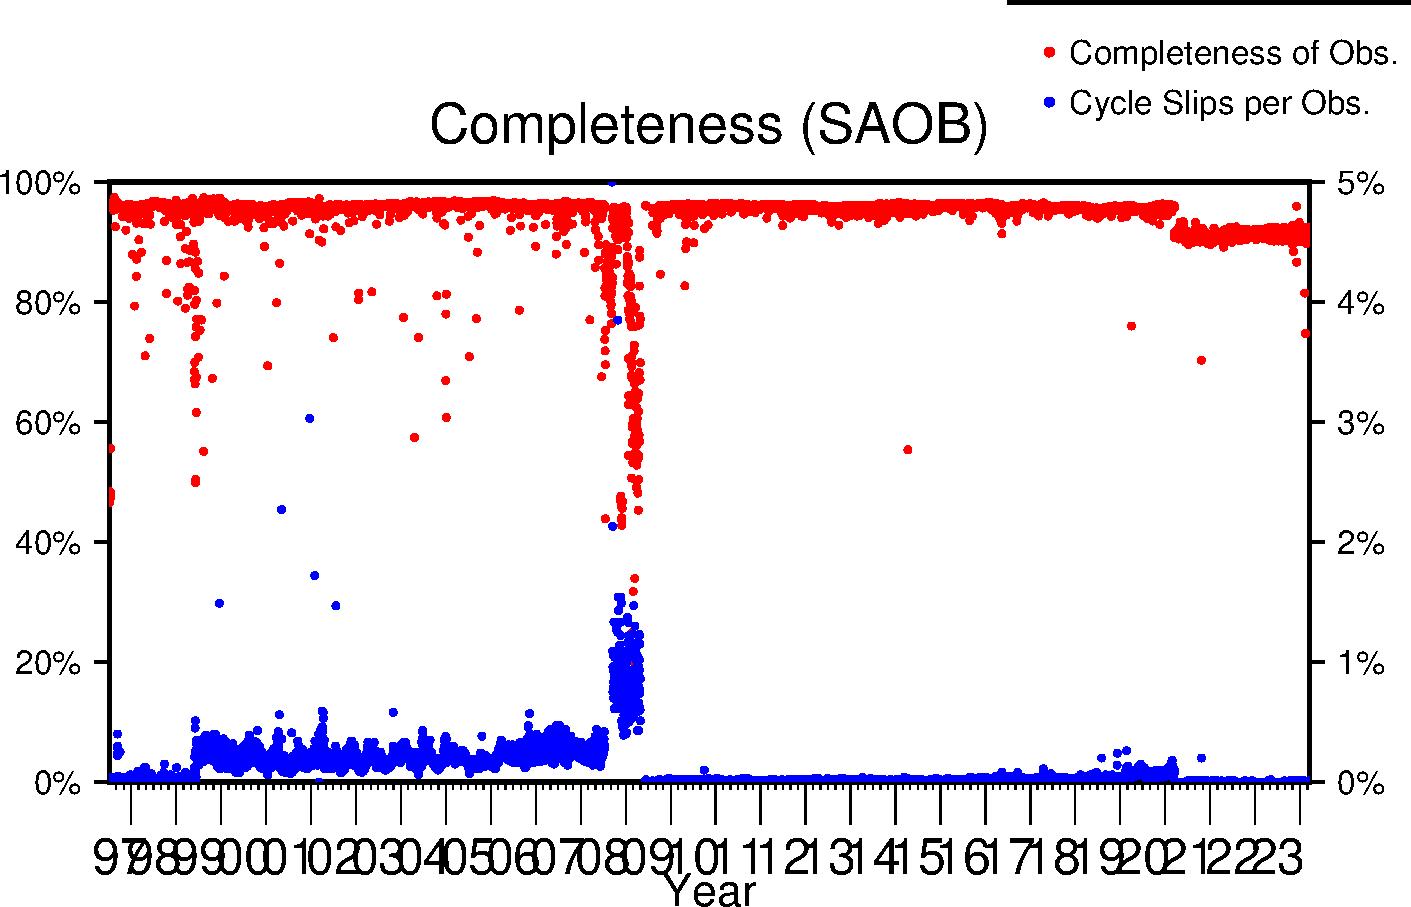 |
Multipath
The effects of multipath on the data are estimated by parameters for L1 and L2 (MP1 and MP2 respectively); see Estey and Meertens (GPS Solutions, 1999) for derivation. The daily value is the RMS of MP1 and MP2 throughout the day and for all satellites. Higher values indicate a greater prevalence and/or strength of multipathing, i.e. objects on the ground are providing multiple reflection pathways from the satellite to antenna.
| Previous Year |
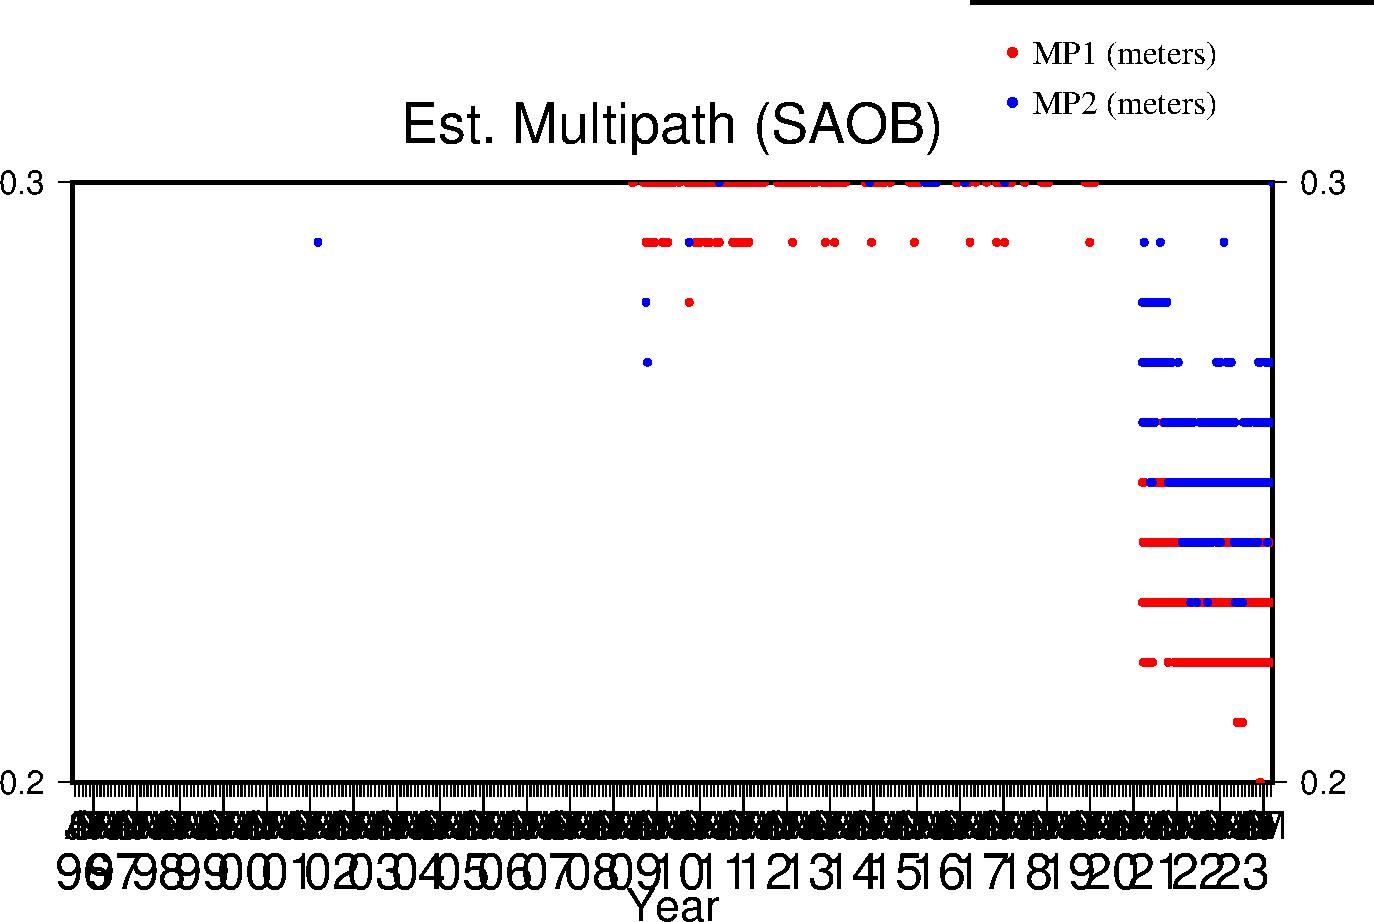 |
| Lifetime |
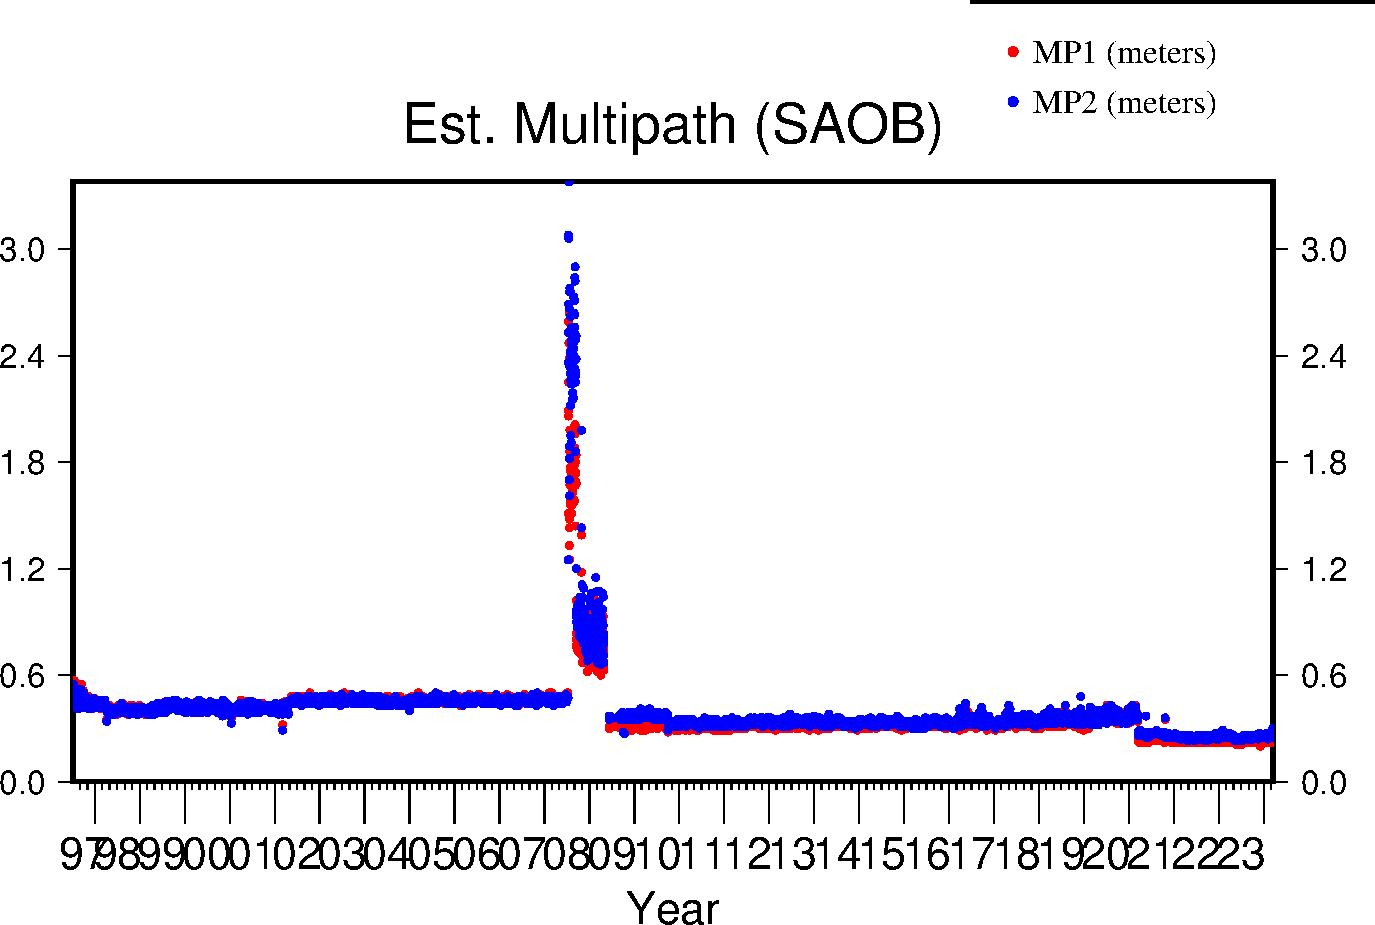 |
Signal-to-Noise Ratio
The Signal-to-Noise ratios are the mean values above the QC elevation mask for L1 and L2 respectively.
| Previous Year |
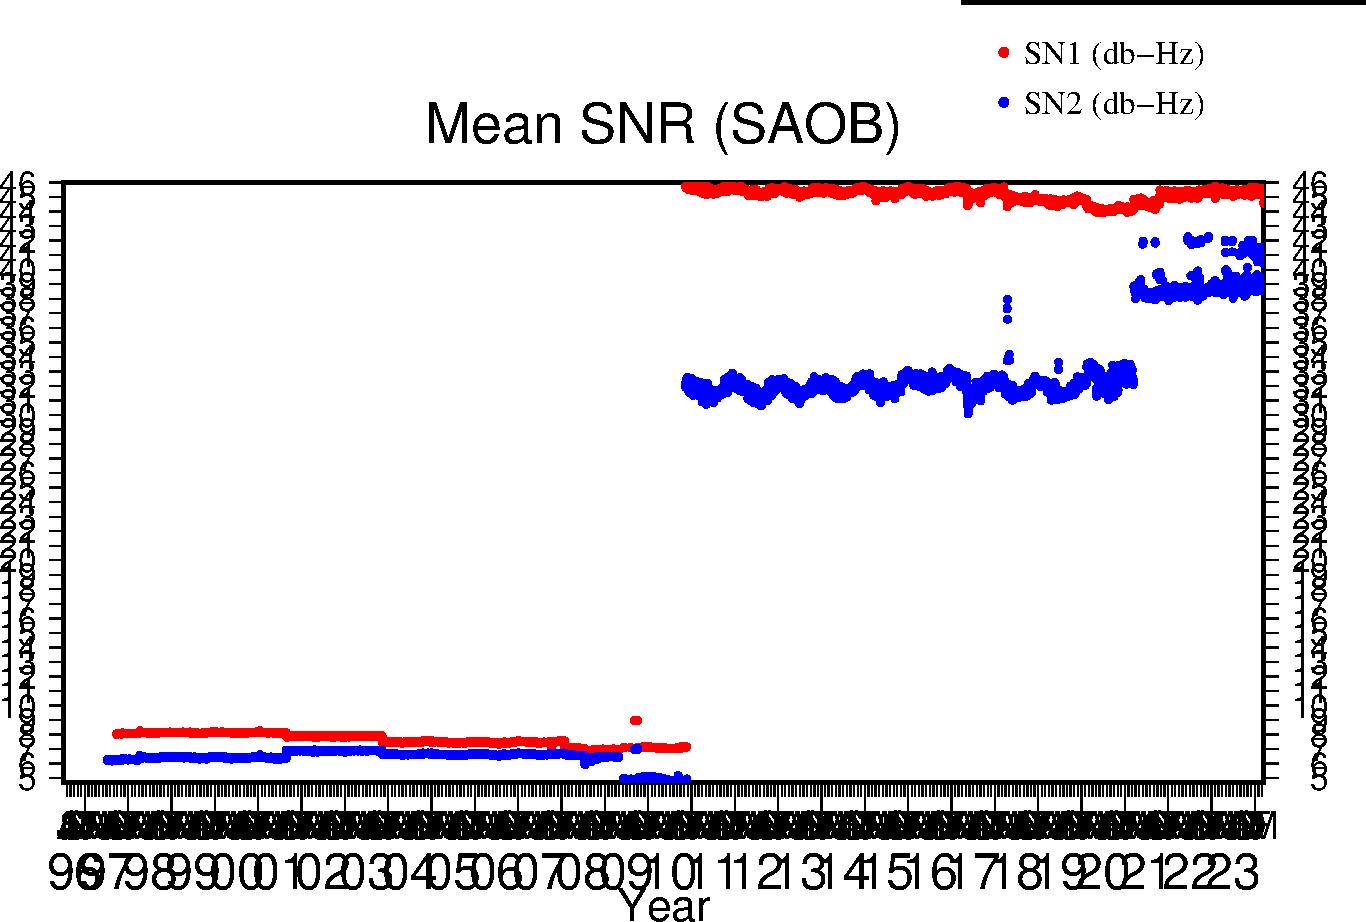 |
| Lifetime |
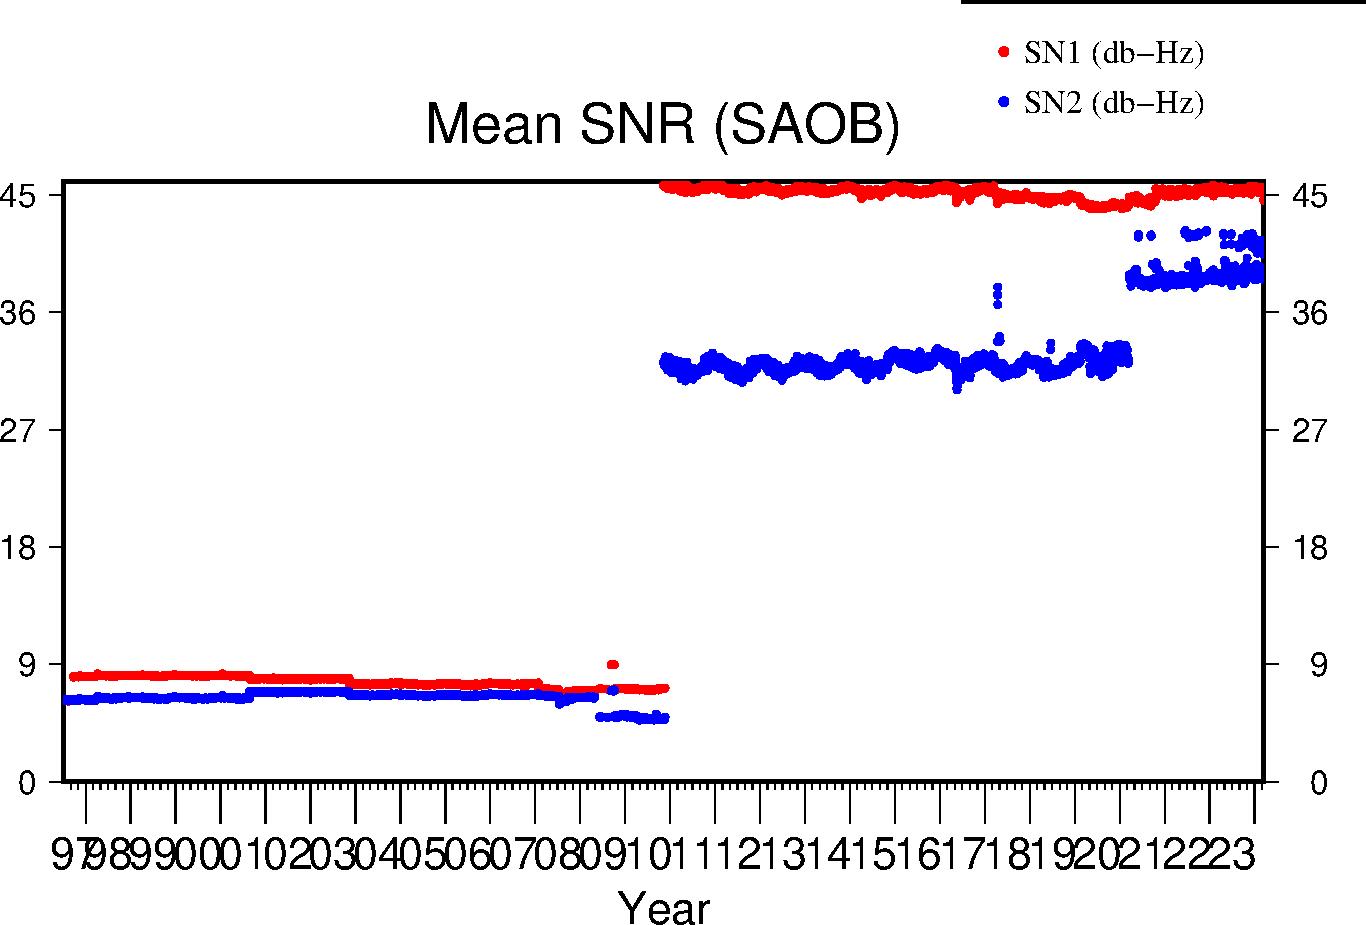 |