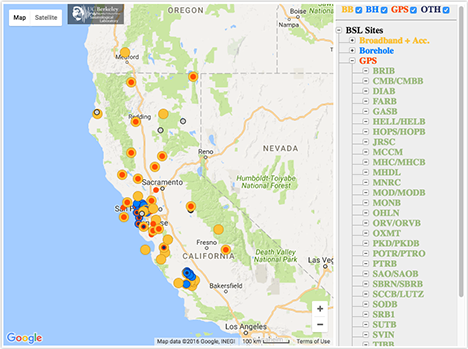
BSL logo


WDC - Whiskeytown Dam, Whiskeytown, CA, USA

View of WDC dome

View of WDC dome

1992/09/17 19:23:00 - Present

Latitude: 40.5799
Longitude: -122.5411
Elevation: 268.30 meters

Typical STS-2 installation

Typical STS-2 installation

Location | Geology | Vault Conditions
Instrumentation | Network | Operation Notes
Noise Characteristics | Data Availability

Location:
Site is located in the NEED camp of the Whiskeytown-Shasta-Trinity Recreational Area, under the auspices of the US National Park Service. WDC is also a cooperative station with the Advanced National Seismic System.

Geology:
Gneiss

Vault/Borehole conditions:
The sensors are located approximately 150' into a tunnel and encased in a steel tank which is located on a poured concrete pad. Approximately 25 meters of overburden cover the tunnel. The datalogger and supporting equipment is located in an external building and connected via conduits.

Instrumentation:
SensorDataloggerStart DateEnd DateSEED ChannelsLocation
Battery VoltageQ9352001/06/01PresentUE?,LE?
Internal TemperatureQ9352001/06/01PresentUK?
Kinemetrics FBA-23 Accel. (2 g max 1.25 v/g)Q9351992/09/17PresentLL?,BL?,HL?
Motorola MPX201 PressureQ9351996/05/30PresentLD?
Streckeisen STS-2 VBB Tri-Axial SeismometerQ9351992/09/17PresentUH?,BH?,VH?,LH?,HH?
Streckeisen STS-2 VBB Tri-Axial SeismometerQ9352001/06/01PresentUM?
YSI 44031 ThermistorQ9351996/05/30PresentLK?

Network:
BK (Berkeley Digital Seismic Network)

Operation Notes: (may not be current)
This section summarizes major changes in equipment or in instrumentation at WDC.

  • 06/15/2004: Changed BH channels sampling rate to 40 Hz.
  • 10/11/1999: Q980 upgraded to MSHEAR software.
  • 06/11/1998: Upgraded Q980 with 4 Gb disk and ethernet card.
  • 06/01/1996: Installed barometer/thermometer package.
  • 02/02/1996: Frame-relay telemetry installed.
  • 07/20/1995: Replaced STS-2.
  • 02/04/1994: Replaced GOES clock with GPS clock.
  • 07/14/1992: A Streckeisen STS-2 and a Kinemetrics FBA-23 were installed with a Quanterra Q980 digitizer.

Noise Characteristics:
The figures below are cumulative plots of power spectral density (psd) determined from the broadband channels. In each figure, the vertical component psd is plotted with blue diamonds, the north component psd with red squares, and the east component psd with green circles. The results are presented in the 5 different frequency bands, and the USGS/Albuquerque low noise model is plotted as a dashed line in each. The PSD units are in dB (decibel) relative to 1 (m/s**2)**2/Hz. The current annual plot is updated weekly.

Cumulative PSD results
1999 2000 2001 2002 2003 2004 2005
1999 PSD 2000 PSD 2001 PSD 2002 PSD 2003 PSD 2004 PSD 2005 PSD

Data Availability:
BDSN waveforms and associated metadata are available at the Northern California Earthquake Data Center (NCEDC).

Several tools provide access to SEED format data at the NCEDC, both in terms of querying the archives and allowing data requests.

Help on using these tools is available.

BDSN Overview | Map | Table


Berkeley Seismological Lab
215 McCone Hall, UC Berkeley
Berkeley CA 94720-4760
www@seismo.berkeley.edu

UC Berkeley seal

Copyright 1995-2005, The Regents of the University of California.
Last modified: Tue Dec 9 08:31:30 PST 2008