The Berkeley Seismological Laboratory conducts essential research on earthquakes and solid earth processes while collecting and delivering high quality geophysical data.
We provide robust earthquake and hazard information including real-time alerts to the public, in collaboration with our partners.
We enable the broad consumption of earthquake information by everyone while educating and training students at all levels and from all backgrounds.

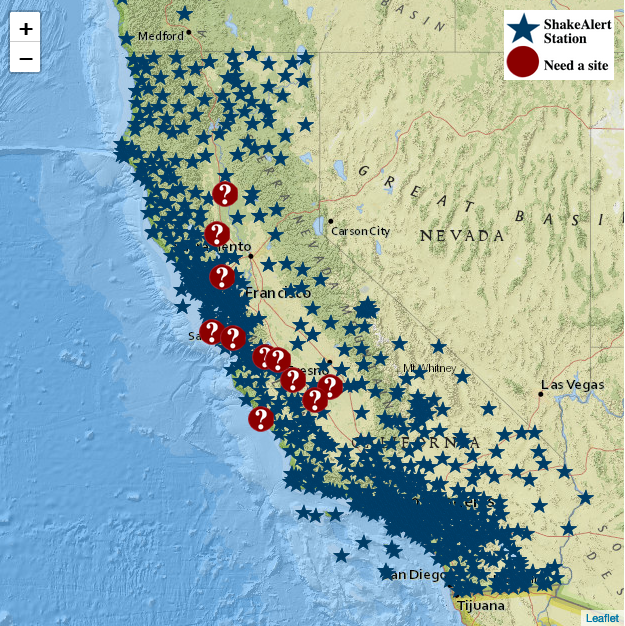
Seismic station on remote Farallon Islands gets critical upgrade
In late January, seven engineers from the Berkeley Seismological Laboratory helicoptered into the Farallon Islands, a windswept, nearly treeless chain of islands 30 miles off San Francisco's Golden Gate, on an eight-day...
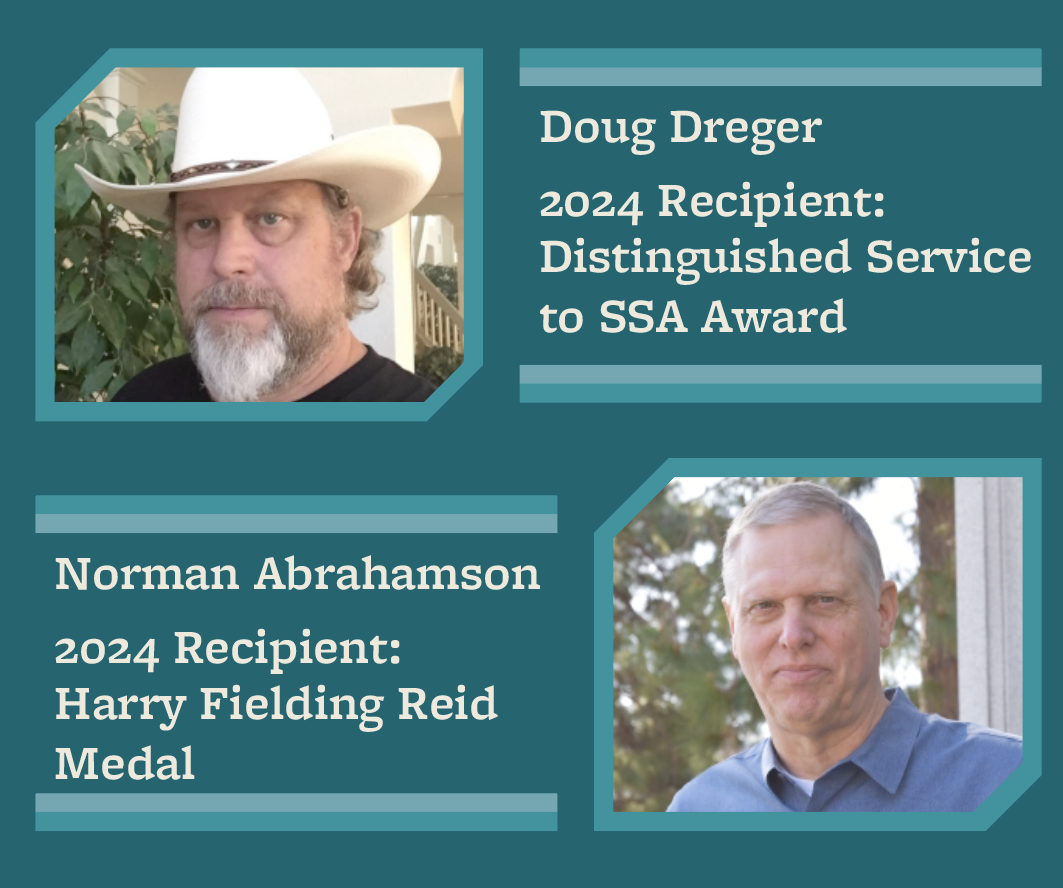
2024 SSA Honors Recipients Announced
Congratulations Professor Doug Dreger and Adjunct Professor Norman Abrahamson! Doug Dreger has received the Distinguished Service Award for his contributions as chair of the SSA Publications Committee from 2016 to 2022. Norman Abrahamson has received the 2024 Reid Medal for his extensive work in the field of probabilistic seismic hazard assessment.
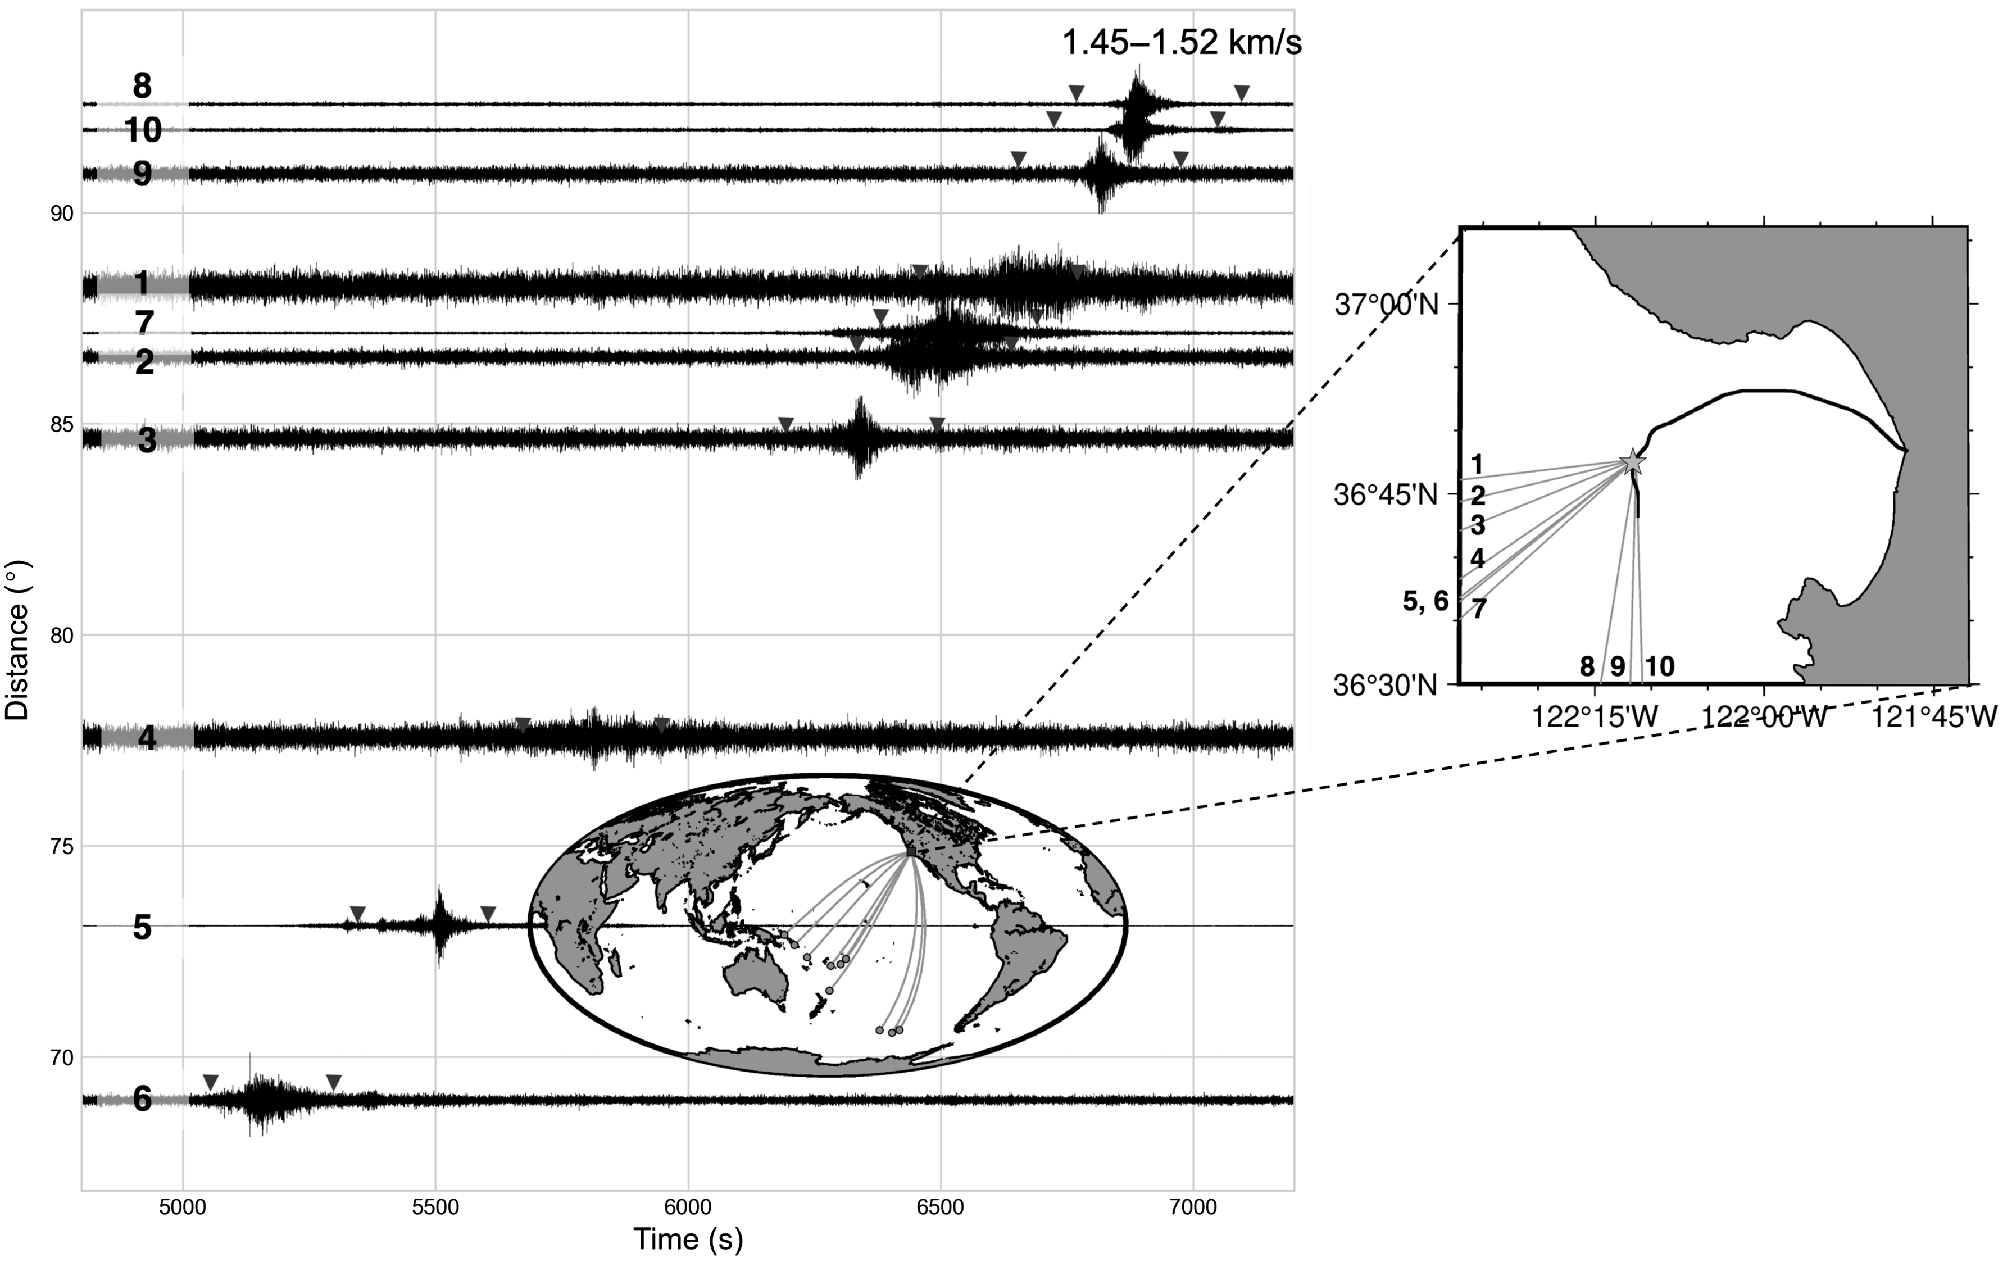
SeaFOAM: A Year‐Long DAS Deployment in Monterey Bay, California
Distributed acoustic sensing (DAS) is being explored in a variety of environments as a promising technology for the recording of seismic signals in...
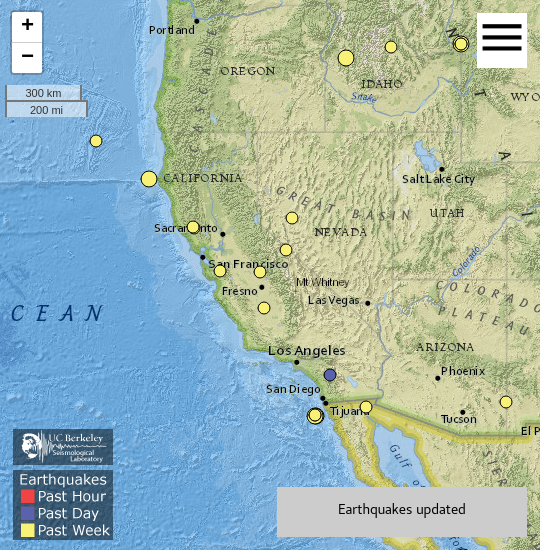
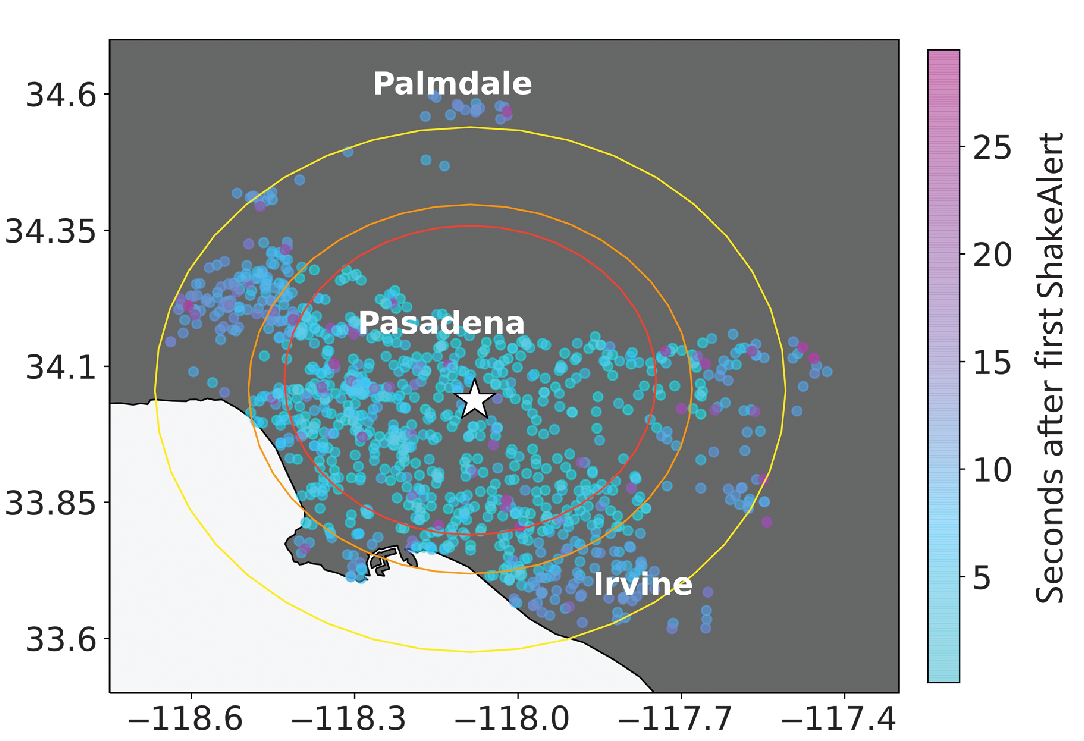
California earthquake puts early warning system to the test
As sensors picked up the first signs of a strong earthquake jolting the Northern California coast, an alert was blasted to 3 million smartphone users telling them to “drop, cover, hold on.” It was hailed as the biggest test yet of the warning system since its public launch.
From ShakeAlert to smartphones: Earthquake Early Warning now and beyond
Getting notifications to people in the event of an earthquake is a key component of earthquake early warning systems. Apps like MyShake and companies like Google are leading the way.

Dr. Harriet C.P. Lau wins Packard Foundation Fellowship
Dr. Harriet C.P. Lau received a 2022 Packard Foundation Fellowship for Science and Engineering. Lau and her research group will use this generous award to better understand how mantle and crustal deformation influences Earth's climate system over vast timescales.
Shake Alert: Earthquake preparedness w/ Dr. Jennifer Strauss
Dr. Jennifer Strauss discusses earthquake preparedness and how the new Shake Alert system can give emergency response just enough notice to begin preparing to respond.