Seismo Blog
Alerts for the Whole West Coast
May 5, 2021
It was a decade in the making, but on Tuesday it became reality. The whole US West Coast is now covered by a single, uniform early warning system against the devastating effects of earthquakes. Washington was the last of the three states along the Pacific Coast to join the system dubbed “ShakeAlert”, which can give up to 60 seconds, or even more, of warning before strong seismic waves generated by an earthquake hit a location. The system developed by university researchers and operated by the federal government has been providing public alerts in California since October 2019. Oregon followed in March 2021 and with Tuesday's announcement by Washington's State Emergency Management Division the approximately 50 million people living in the seismic hazard zones of the three western states can be warned before strong seismic shaking hits their homes or work places.
As described in this blog several times, ShakeAlert does not deliver an earthquake prediction or a forecast days or weeks ahead of a potential catastrophic temblor. The physical processes along an earthquake fault before and during a rupture are so complex that seismologists have all but given up on trying to achieve the elusive goal of predicting when a strong quake will happen. Once a temblor has started however, scientists are able to issue warnings of impending shaking. This is possible despite the fact the seismic waves race through the Earth at speeds of several thousand miles per hour. For issuing a warning ShakeAlert uses the fact, that light – and thus also radiowaves or digital information through an internet cable – travels even faster, usually about one hundred thousand times the speed of seismic waves.
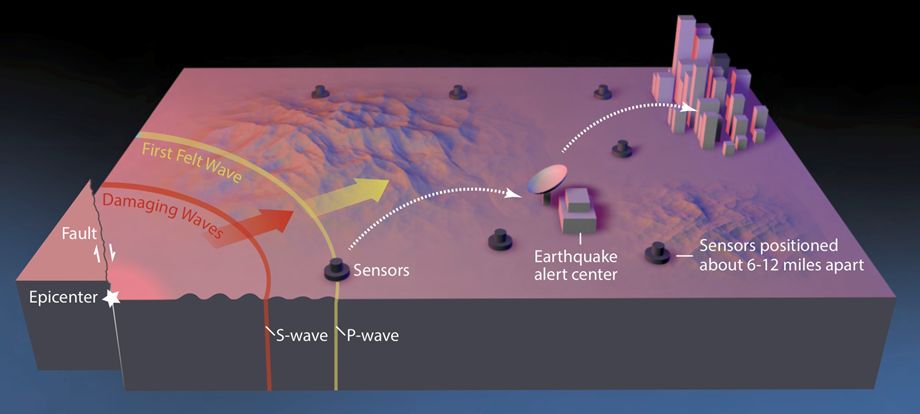
Schematic of the earthquake early warning process: Seismometers detect the P-waves of a quake close to them and send a signal to the alert center. There computers calculate the magnitude and the possible shaking and then deliver it to the cell phone networks. The reason that this works: Seismic waves are about 100,000 times slower than the speed of light – the speed which with information gets distributed by radio waves or by internet cables.
Here is how it works in a nutshell: A dense network of seismic stations detects the beginning of an earthquake. These stations deliver their discoveries at lightning speed to data centers, one of them operated here by the Berkeley Seismology Lab (BSL), where one set of computers automatically calculates the location and the potential magnitude of the quake that has just started. Another set of computers then determines when seismic waves from that quake will hit certain locations. This information is transmitted to cell phones in the areas that can expect shaking. The complex calculations in the data centers take only a fraction of a second.
Although it takes a few more seconds to disseminate the warnings via the cell phone networks, there is time enough for the recipients to take action. People can drop, cover, and hold-on under a sturdy table or a desk to protect themselves from objects shaken loose by the seismic waves. Elevators in high rises can be programmed to stop at floors and open their doors when they receive the warning so that people don't get trapped in them for hours. Trains can be slowed or even stopped to reduce the risk of derailment, garage doors at fire stations can be opened before the shaking arrives so they don't jam and trap emergency vehicles inside. Industrial processes can be automatically interrupted to avoid chemical spills, contamination or even fires. The possibilities for taking protective action within a few seconds are limitless.
To achieve earthquake early warning is not cheap. The networks of seismic monitoring stations must be densified considerably and brought up to modern technical standards, including for fast telemetry. For example, in the past five years the seismic network in northern California, operated jointly by the BSL and the United States Geological Survey (USGS) office in Menlo Park grew substantially by several hundred stations and is still being densified. The data centers are now equipped with redundant computer systems hardened against seismic shaking and power outages. The major part of this investment has come from the federal government which has spent $130 million on the development on the ShakeAlert System. California's Office of Emergency Management has contributed nearly $60 million for research, seismometer installation, and other infrastructure. Oregon chipped in $8.5 million. Washington’s Legislature allocated $1.2 million, mostly for seismic stations.
Although ShakeAlert is a uniform system across all three states, the seismic hazards in the different regions are not at all uniform. While most of California, from the Salton Sea in the South to Cape Mendocino in the North is dominated by the tectonic movement along the San Andreas and its sister faults, the movement of the plates in northernmost California and the two neighboring states is quite different. Instead of horizontally scraping past each other as in much of the Golden State, one plate subducts under the other further north. Such subductions zones are capable of producing the strongest earthquakes in the world, like the Sumatra quake in 2004 or the Tohoku earthquake, which devastated parts of the Japanese main island of Honshu in 2011. In addition, such quakes can generate devastating tsunamis, a hazard hardly posed by the strike slip quakes occurring in the larger region of California.
While the different hazards are given by nature and cannot be changed, there is another catch with the recent roll-out of the ShakeAlert warning system in Washington. Cell phone users in California and Oregon have three different ways to receive the alerts. They can rely on the relatively slow Wireless Emergency Alert System – also known as “Amber Alerts” - operated by the federal government. Android users can be warned by a warning capability built into their phones. Or all cell phone users can be warned by one of two apps. The MyShake app, developed at the BSL and adopted as the official warning app by the California Office of Emergency Services, and the QuakeAlertUSA app developed by Early Warning Labs are available in California and Oregon. Unfortunately, neither app is available for the Washington segment of ShakeAlert. This is currently a major shortcoming which hopefully will be corrected soon. (hra174)
BSL Blogging Team: Who we are
Recent Posts
-
: Alerts for the Whole West Coast
-
: Destruction in the Eastern Aegean Sea
-
: An Explosion in Beirut heard all over the Middle East
View Posts By Location
Categories
- Alaska (3)
- Bay Area (24)
- Buildings (3)
- Calaveras (4)
- California (13)
- California ShakeOut (3)
- Central California (4)
- Chile (4)
- Earthquake Early Warning (10)
- Earthquake Faults and Faulting (44)
- Earthquake Science (3)
- Haiti (3)
- Hayward (12)
- Indonesia (4)
- Induced Seismicity (3)
- Instrumentation (18)
- Italy (6)
- Japan (7)
- MOBB (3)
- Mendocino Triple Junction (5)
- Mexico (7)
- Nepal (3)
- North Korea (5)
- Nuclear Test (5)
- Ocean Bottom Seismometer (3)
- Oklahoma (4)
- Plate Tectonics (18)
- Preparedness, Risks, and Hazards (16)
- Salton Sea (3)
- San Andreas Fault (14)
- Seismic Waves (13)
- Seismograms (4)
- ShakeAlert (3)
- Southern California (5)
- Surface Waves (3)
- Today in Earthquake History (20)
- Volcanoes (4)
- subduction (3)