Seismo Blog
How to Read a Seismogram - Part III
Categories: Instrumentation | Seismograms | Seismic Waves
April 29, 2015
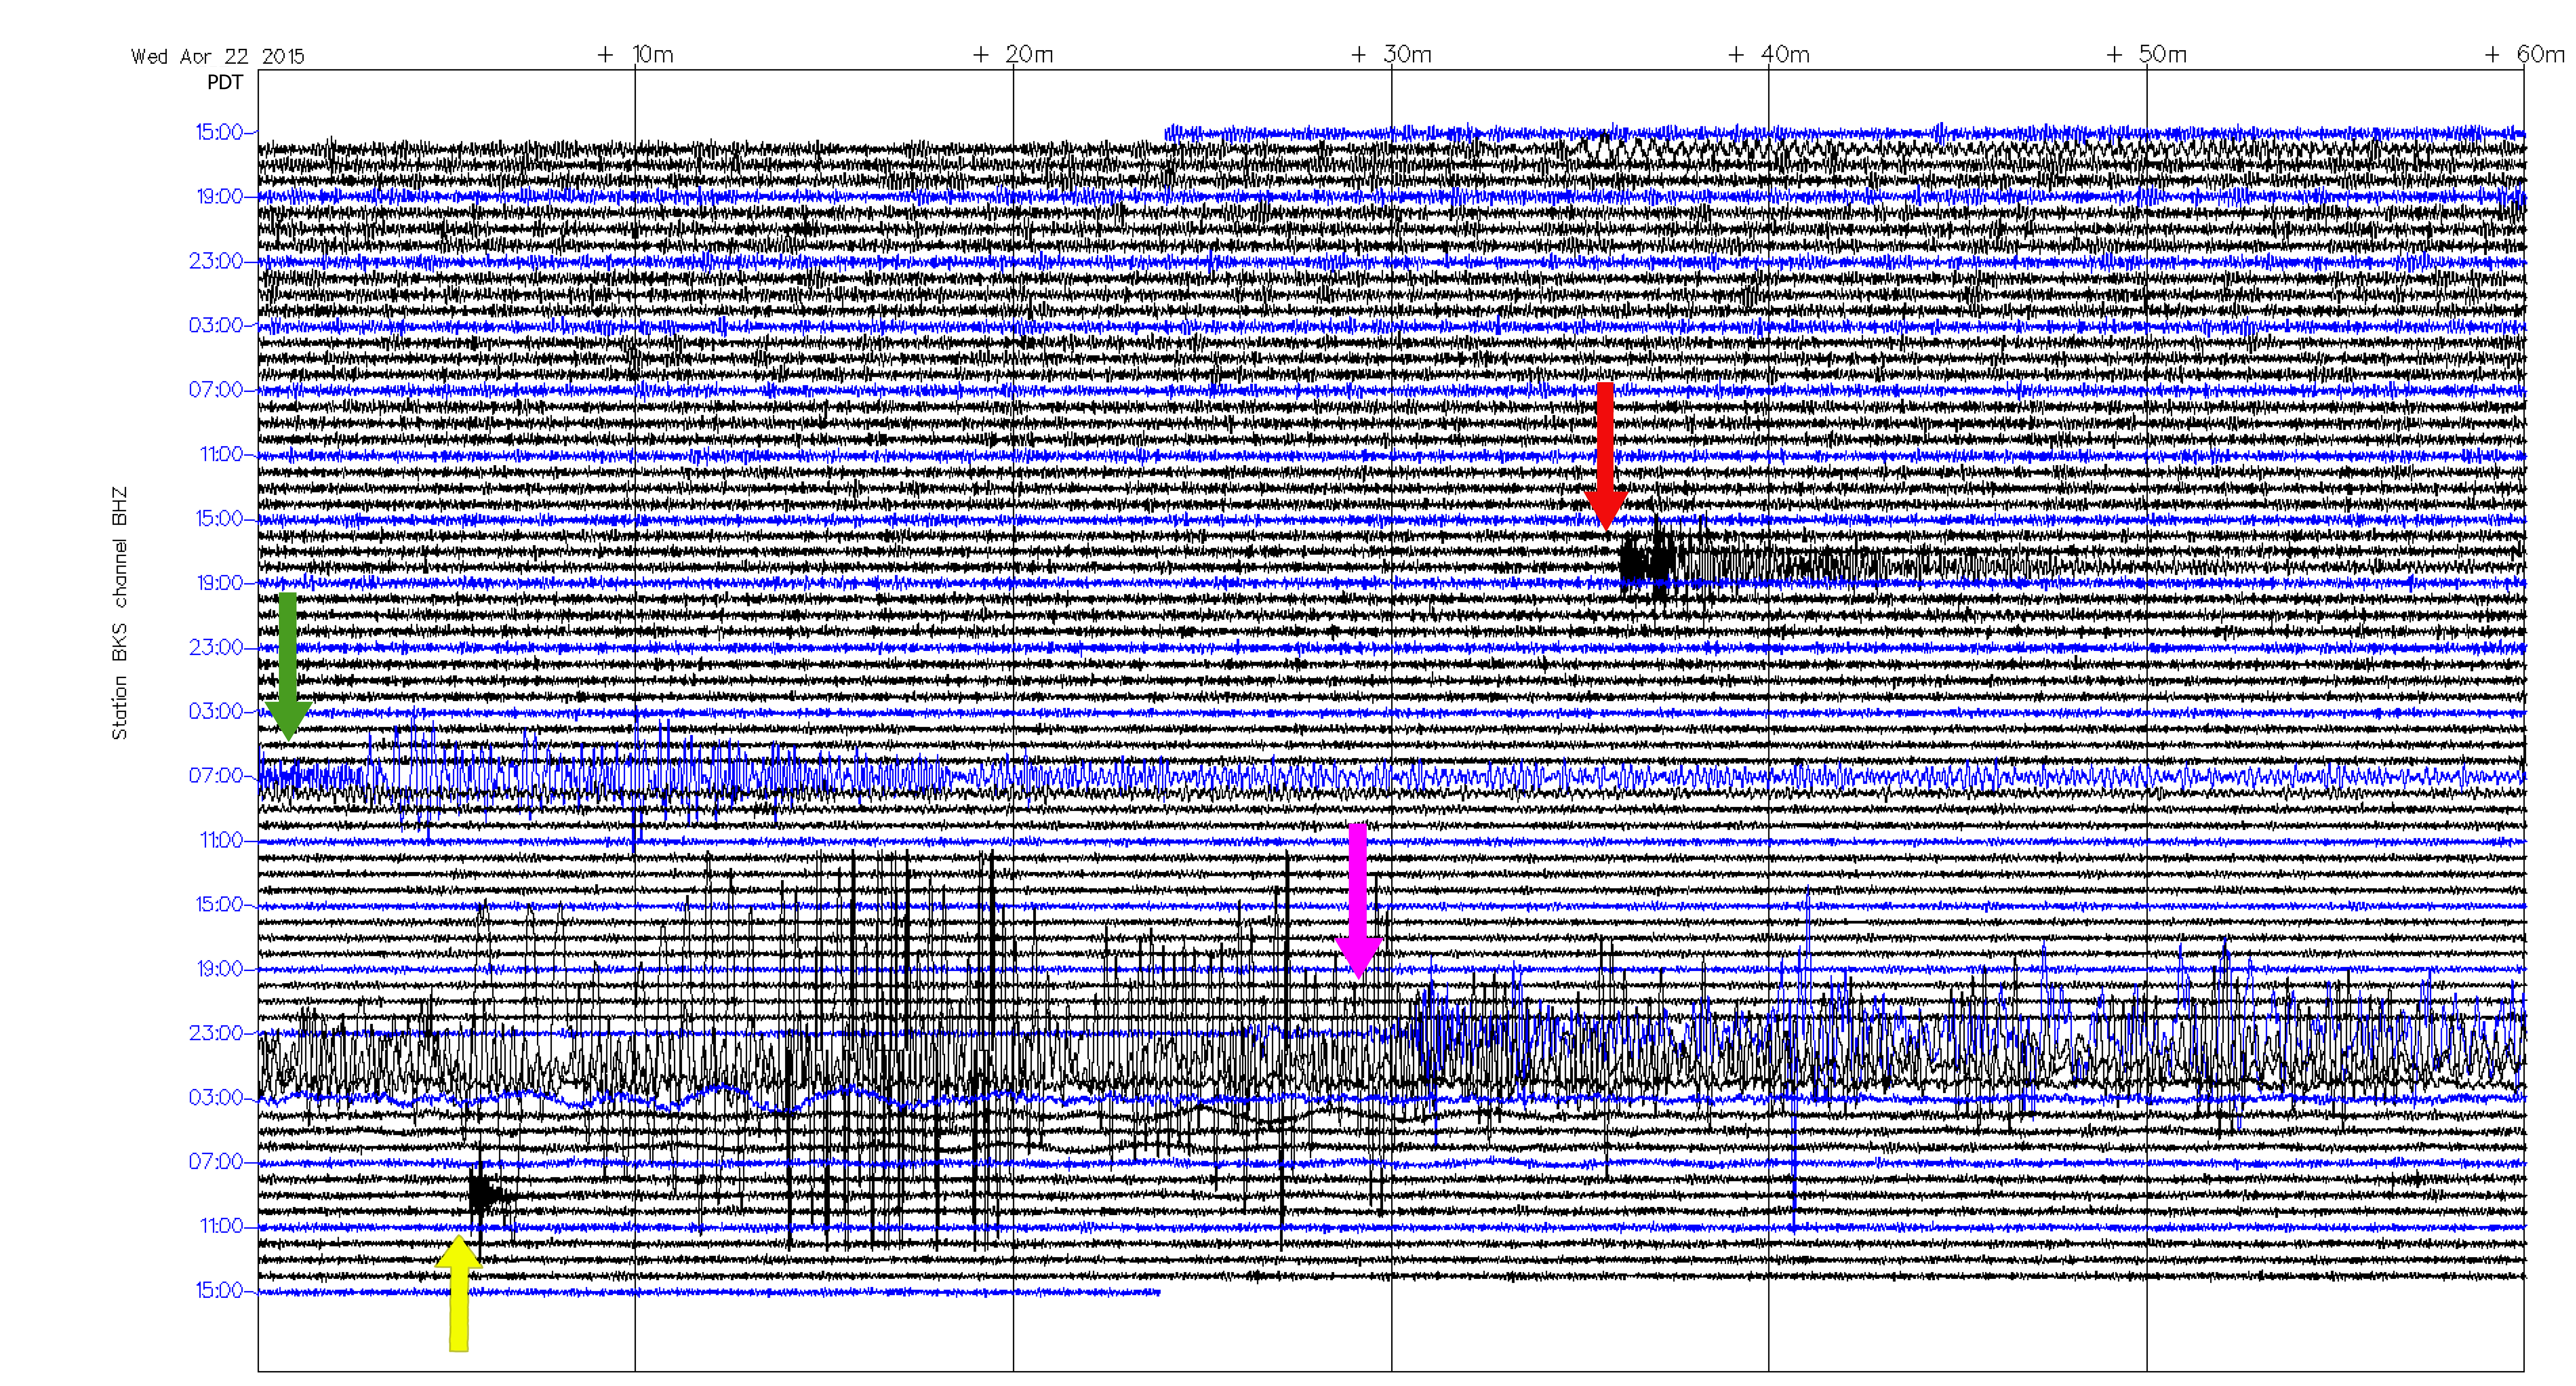
A seismogram from 4/22-4/25 at station BKS in Berkeley, CA.
(Click to view larger image.)
The seismic waves generated by last Saturday's earthquake in Nepal were recorded by seismometers all over the globe, including the ones in the network operated by the Berkeley Seismological Laboratory in Northern California and Southern Oregon. However, looking at the seismogram from our station BKS shown here reveals much more than just the seismic waves originating from the hypocenter in the Himalayas.
BKS is located in a short tunnel leading into the Berkeley Hills at Strawberry Canyon near the UC Berkeley Botanical Gardens. The tunnel - or adit - was dug in the late 50's of the last century. Its three letter code BKS is unique to this station and clearly identifies it - just like SFO or LAX are codes used by airlines and pilots to uniquely describe the international airports in San Francisco and Los Angeles. The data collected by the various seismometers in the tunnel are sent to the Seismolab via the internet and stored on various secured data server computers. The computers, located off site, are protected against fire, flood and earthquakes, so that these valuable data don't get lost. Some of these computers are programmed to display the data, and this is how the picture in this blog was generated.
What looks confusing at first can easily be deciphered when you think of reading it line by line, like a page in a book. Each line, read from left to right, shows the motion of the ground caught by the seismometer over exactly one hour, indicated by the 10 minute marks along the top of the picture. The vertical markings depict the actual time in Pacific Daylight time in the 24 hour format. Using these markers one sees that the seismogram begins last Wednesday, April 22, at 3:22pm, as indicated by the blue top line. It ends 72 hours later with the last line on Saturday, April 25, on 3:22 pm. In order to make reading the lines a little bit easier, every fourth line is colored blue, the three lines in between are black.
Looked at through the eyes of a seismologist, this seismogram is actually very unique, because it contains four different kinds of earthquakes, all of them pictured here in a textbook manner. Let's start with the last one (yellow arrow) first: What looks like a black smudge is actually a magnitude 3.3 quake which occurred on Saturday around 9:05 am near the small town of Cobb in The Geysers areas of Lake County. Its epicenter lies about 70 miles north northwest of BKS and it took the first seismic wave about 20 seconds to reach the seismometer. Because of the short distance such a quake is called a local earthquake. These quakes can be spotted on seismogram because they are short, lasting just about a minute.
Now let's look at the quake indicated by the red arrow: It shook the seismometer for more than 12 minutes, starting again with a black smudge, but then after about 2 minutes follow clear wave motions motion. This is the recording of a magnitude 5.5 earthquake, which happened last Thursday at 6:35 pm about 150 miles off the coast of Cape Mendocino. Because this quake's epicenter lies about 350 miles away from BKS, it took the first wave about 2 minutes to reach Berkeley. The greater distance also causes the waves of this quake to be more spread out in time as the local event. Such a quake is commonly called a regional event.
The third set of seismic waves (green arrow) woke up the seismometer last Friday shortly after 7am. They originated from an M6.2 earthquake just south of the Island of Haida Gwaii (formerly known as Queen Charlotte Islands) off the coast of the Canadian Province of British-Columbia. The distance between the epicenter and Berkeley is more than 1050 miles. As a consequence the shaking under BKS lasted more than an hour. You can see the whole blue line wiggle.
The dominant feature in the seismogram is - of course - the Nepal earthquake. The arrival of its first seismic wave is indicated by the pink arrow. It lasts several hours and the waves were strong enough to cause the largest amplitude of ground motion in this seismogram. Our seismometers at BKS are also sensitive enough to record the Nepali seismic waves traveling around the world several times. Both the quake off Canada as well as the quake in Nepal fall under the category of teleseismic events. (hra103).
For more information on how to read seismograms, see our previous two blogs on how to read seismograms (Part I and Part II).
BSL Blogging Team: Who we are
Recent Posts
-
: Alerts for the Whole West Coast
-
: Destruction in the Eastern Aegean Sea
-
: An Explosion in Beirut heard all over the Middle East
View Posts By Location
Categories
- Alaska (3)
- Bay Area (24)
- Buildings (3)
- Calaveras (4)
- California (13)
- California ShakeOut (3)
- Central California (4)
- Chile (4)
- Earthquake Early Warning (10)
- Earthquake Faults and Faulting (44)
- Earthquake Science (3)
- Haiti (3)
- Hayward (12)
- Indonesia (4)
- Induced Seismicity (3)
- Instrumentation (18)
- Italy (6)
- Japan (7)
- MOBB (3)
- Mendocino Triple Junction (5)
- Mexico (7)
- Nepal (3)
- North Korea (5)
- Nuclear Test (5)
- Ocean Bottom Seismometer (3)
- Oklahoma (4)
- Plate Tectonics (18)
- Preparedness, Risks, and Hazards (16)
- Salton Sea (3)
- San Andreas Fault (14)
- Seismic Waves (13)
- Seismograms (4)
- ShakeAlert (3)
- Southern California (5)
- Surface Waves (3)
- Today in Earthquake History (20)
- Volcanoes (4)
- subduction (3)